Autocorrelation Influences
My answer is a bit of a two-parter, the second part largely being more important than the first. First, a bit about autocorrelation...
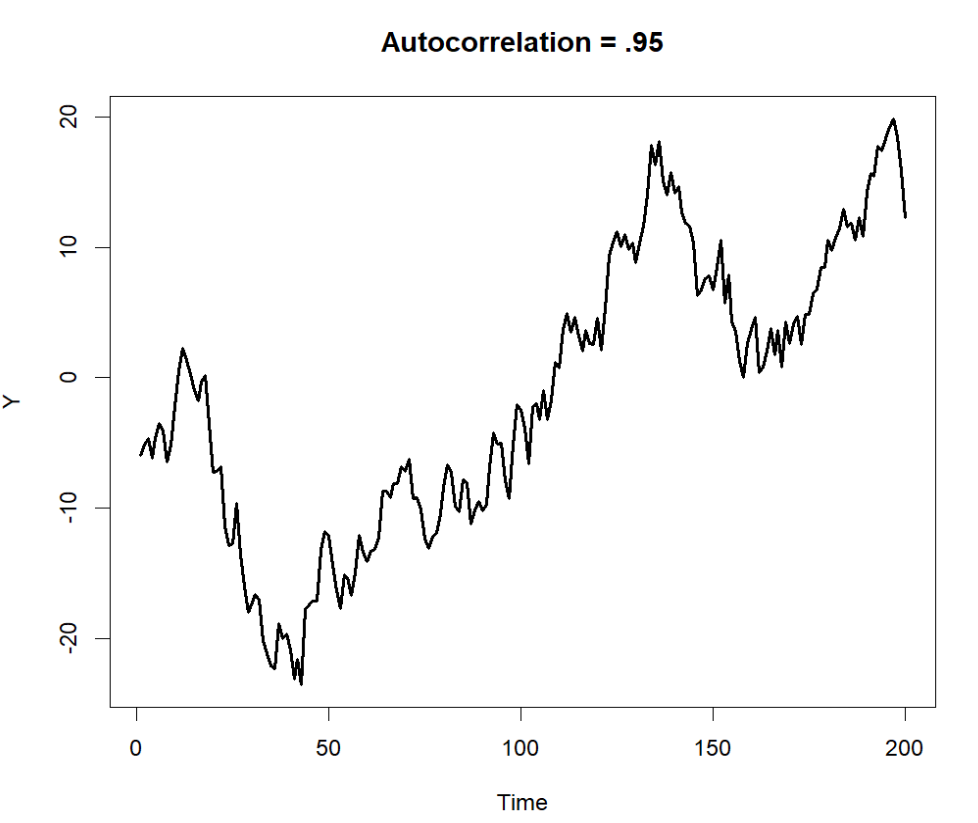
Consider the following data that I just simulated in R, which has a substantial autocorrelation:

If we look at each "zig" or "zag" in this plot, we see generally that each original value is heavily weighting where the next point will go. If there was no relationship we would instead have something completely random like this:

One can see that autocorrelation then implies a heavy dependence between data points, and will consequently have a large bearing on the $p$ values. Leaving them unaccounted for will provide only biased results, and thus it is no surprise that your $p$ values change in some way based of that modeling decision.
On Reporting Null Effects
This isn't an annoyance with you, but this statement really drives me crazy because of how often I see it:
What does this mean? Is my regression useless?
I blame this on how badly most methods courses are taught in grad school, but there are two major issues with this statement.
- Your analysis doesn't increase/decrease in importance due to statistical significance.
- Getting an unexpected result is not a failure.
To the first point, under the NHST paradigm, a $p$ value simply states the probability of a given estimate given the null hypothesis is true. If a $p$ value is higher than some arbitrary alpha cutoff, this means we cannot reject the null hypothesis, but neither can we accept the null in lieu of this information. One suspends judgement until further research is committed to answering those questions. The null hypothesis anyway is sometimes called the "dull hypothesis", because most people do not believe there can be an absolutely zero effects anyway.
For the second point, unexpected results give you a unique opportunity: a surprising result is an interesting result! What often confuses us should motivate us to find out more. Why was my data not to my expectation? Was it because there is perhaps an angle I haven't investigated? Was it because of sample-level characteristics? These are the sorts of questions one should really be asking when this happens.
As an example of how even "useless" results can be interesting, the inventor of the Post-It note was originally testing what was supposed to be an adhesive that should have been stronger than any other before it. But to his dismay, the objects which he applied the adhesive to could be easily removed. After a lot of brainstorming, this later led to the invention of Post-It notes when considering paper-based applications like bookmarks.
Finally, I strongly suggest that you not only plot your data, but also look at the coefficients, effect size, etc. I sincerely doubt your predictors have no association with the outcome. This is the danger of $p$ values. People get so blinded by them that that don't actually investigate whether or not there is a positive/negative association and by how much. This is equally, if not more important, than $p$ values alone.


