1
$\begingroup$

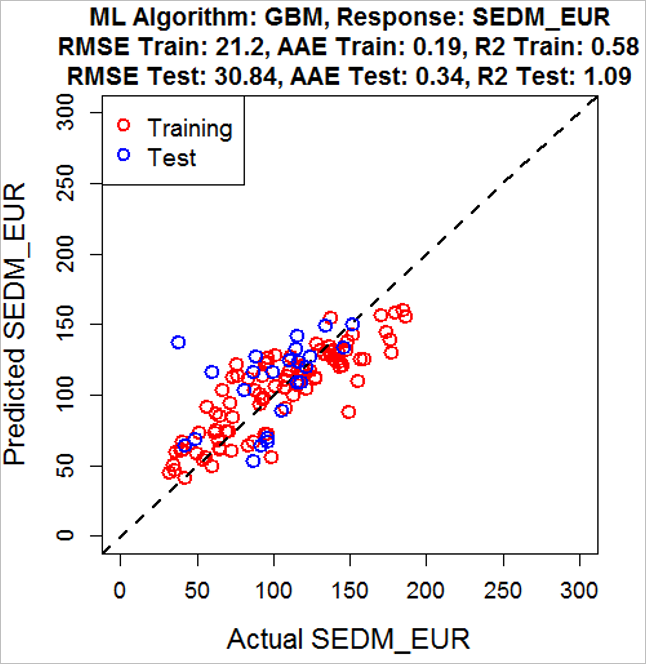
train-test splits shown in BLUE and RED circles in an actual vs predicted plot of a model

This image is from a paper where the author has trained and then tested different models on a small dataset (consisting of 117 samples in total). I had the following observation and their questions alongside. (He has computed R2 = SSR/SST, although several programming languages like Python compute R2 = 1- SSE/SST)

  • R2_test>1>>R2_train: For several models (>90%) the author has trained and tested, I found this relation, where the R2 of the test set exceeds 1 and far exceeds R2 from the train split. If the claim for an accurate model is right, how can it justify R2>1 (meaning SSR>SST). Also how is it possible to consistently have a better R2-score for the test split than the train split? (It cant be a pure coincidence! Or is it a problem related to a small dataset, data-leakage?)
$\endgroup$
6
  • $\begingroup$ That plot is hard to read and it doesn't seem to bear much of a resemblance to your text. For instance, it doesn't display any $R^2$ values. Could you please describe it and be more specific about what you are asking? $\endgroup$
    – whuber
    Commented Aug 6 at 21:38
  • 1
    $\begingroup$ You can calculate whatever you want. However, the trouble with calculating SSR/SST in this situation is that it is the exception, rather than the rule, that SSR/SST = 1 - SSE/SST. I fear the author took a shortcut to calculating what I find rather meaningful in 1 - SSE/SST by calculating a less imformative SSR/SST. Here is the math. Pay attention to the "other" term and if it is zero out-of-sample (probably won't be, breaking the SSR/SST = 1 - SSE/SST equality that holds in some cases). $\endgroup$
    – Dave
    Commented Aug 6 at 22:34
  • $\begingroup$ @whuber I have changed the image to a bigger one. Can you please comment? $\endgroup$
    – Sauvik Das
    Commented Aug 7 at 1:18
  • $\begingroup$ @Dave Thank for sharing the post and explaining how R2 relations can be different for a linear and non-linear regression. I'm also concerned about the R2_test>1>>R2_train in about 15 of the 20 models built and almost all of them R2_test>R2_train. What do you think? $\endgroup$
    – Sauvik Das
    Commented Aug 7 at 1:24
  • 2
    $\begingroup$ I'm truly tempted to write-off a study claiming $R^2>1$. The SSR/SST calculation (that can yield a value above one) strikes me as rather unhelpful, except for when it happens to equal the 1 - SSE/SST calculation. But then...why didn't you just calculate 1 - SSE/SST in the first place? (If you have time to do it twice, you had time to do it right the first time!) Could you please give a reference for this paper? If you're reviewing the article, okay, it has to remain anonymous, but you can give the citation for a published paper. $\endgroup$
    – Dave
    Commented Aug 7 at 11:30

1 Answer 1

0
$\begingroup$

The big issue I see is that the paper reports $R^2>1$. Anyone can calculate anything they want and call it anything they want. However, $R^2$ has a somewhat standard meaning as a value that is capped at one, regardless of the multiple typical ways of calculating $R^2$, such as those discussed in my question here. That is, no matter which of those calculations discussed at the link that is used, the value cannot exceed one.

However, this article reports a value exceeding one. I see a few possibilities.

  1. Simple typographical error: the paper contains the wrong value, perhaps because the intern typed $1.09$ instead of the $0.19$ the investigator meant to be reported

  2. Coding error that results in a variable being called r2 yet being calculated in a way that is different from what is meant

  3. Use of a non-standard calculation of $R^2$

From the remark that the author has computed R2 = SSR/SST, the third option seems to be the culprit.

As I show here, the total sum of squares $\overset{N}{\underset{i=1}{\sum}}\left( y_i-\bar y \right)^2$ can be decomposed.

$$ y_i-\bar{y} = (y_i - \hat{y_i} + \hat{y_i} - \bar{y}) = (y_i - \hat{y_i}) + (\hat{y_i} - \bar{y}) $$

$$ ( y_i-\bar{y})^2 = \Big[ (y_i - \hat{y_i}) + (\hat{y_i} - \bar{y}) \Big]^2 = (y_i - \hat{y_i})^2 + (\hat{y_i} - \bar{y})^2 + 2(y_i - \hat{y_i})(\hat{y_i} - \bar{y}) $$

$$ \sum_i ( y_i-\bar{y})^2 = \sum_i(y_i - \hat{y_i})^2 + \sum_i(\hat{y_i} - \bar{y})^2 + 2\sum_i\Big[ (y_i - \hat{y_i})(\hat{y_i} - \bar{y}) \Big] $$

Let's write this more briefly as $ SSTotal=SSRes + SSReg + Other $, better yet, as $SST = SSE + SSR + Other$.

When $Other = 0$, $SST - SSE = SSR$, and $1 - SSE/SST = SSR/SST$. However, it is often the case that $Other \ne 0$, and there is not even a requirement for a particular sign of $Other$. That is, $Other >0$ and $Other <0$ are both possibilities. Even using a linear regression with a least squares fit (the venerable "OLS"), out-of-sample, all bets are off about the sign of $Other$, even setting aside the particular $\bar y$ used in its calculation. Therefore, there is not a certain relationship between a reasonable $R^2$ calculation in $1 - SSE/SST$ and $SSR/SST$, and we could wind up with $SSR/SST > 1 > 1 - SSE/SST$ and report $R^2 = SSR/SST > 1$, despite the $SSR/SST$ lacking much motivation and lacking properties we want our $R^2$ value to have (such as being bounded above by one).

I think the authors noted the equivalence of $1 - SSE/SST$ and $SSR/SST$ in some cases and assumed it would hold in more generality than it does hold, using $SSR/SST$ as a shortcut to calculate $1 - SSE/SST$, only to have it turn out that their assumed equivalence does not hold.

$\endgroup$

Your Answer

By clicking “Post Your Answer”, you agree to our terms of service and acknowledge you have read our privacy policy.

Not the answer you're looking for? Browse other questions tagged or ask your own question.