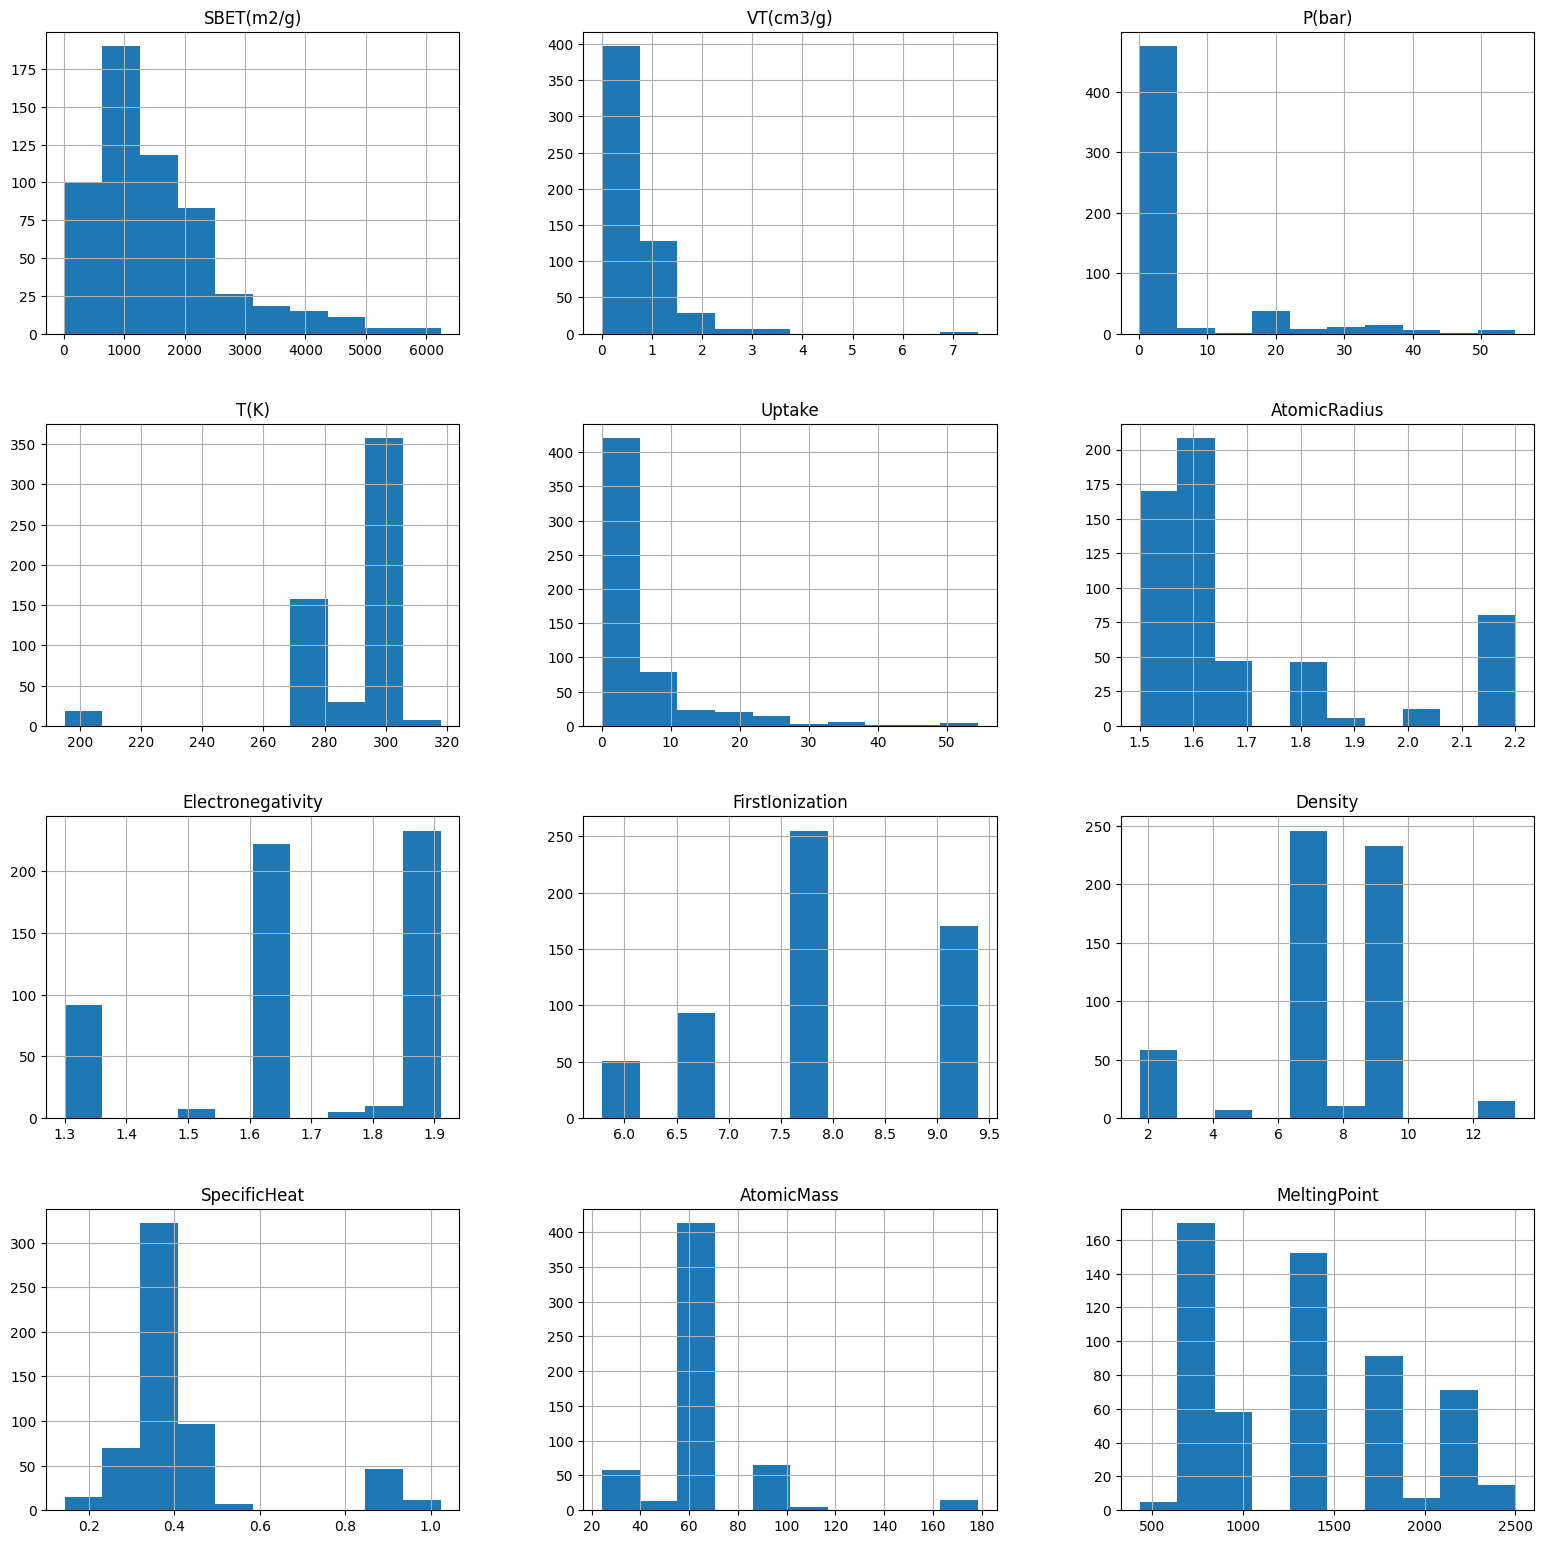
Consider the following small dataset (around 569 data points), where Uptake is the regression target:
As you can see, most of the variables are skewed, with some of them having only 2 or 3 data points in some regions (e.g. VT).
To get some baselines, I decided to run H2O's Random Forest AutoML on different splits of this dataset, as well as on a reduced dataset where the "outliers" (they're not noise, just values in regions where observations are scarce) were removed (about 300 data points remained).
On the original dataset, some splits had very good $R^2$ (close to 0.95)on the test set, but most had average MSE (~3.2). On the other hand, on the reduced dataset, most splits had very good MSE on the test set, but the best $R^2$ across all splits was something around 0.65.
Can anyone explain why this might be happening? Are these "outliers" messing with the $R^2$?
Also, any advice on how these features should be handled (e.g. log transform, ...)?

