6
$\begingroup$

Here is the kind of data I have:

I have two predictor variables:

  1. discrete non-ordinal --> c('a', 'b', 'c')

  2. discrete ordinal --> c(10, 100, 200, 500)

Response variable: Proportion of TRUE over a list of TRUE/FALSE. If the list is of length 3, my variable can take only 4 values. But not all my values come from the same list's length. And moreover the lists are globally long ! So it is discrete proportions but can take more than 100 values.

Here is an example (resp is a subset of my data):

pred_1 = rep(c(10, 20, 50, 100), 30)
pred_2 = rep(c('a', 'b', 'c'), 40)
    
resp = c(0.08666667, 0.04000000, 0.13333333, 0.04666667, 0.50000000, 0.04000000, 0.02666667, 0.24666667, 0.15333333, 0.04000000, 0.06666667, 0.06666667, 0.03333333,
    0.04000000, 0.26000000, 0.04000000, 0.04000000, 1.00000000, 0.28666667, 0.03333333, 0.06666667, 0.15333333, 0.06666667, 0.28000000, 0.35333333, 0.06000000,
    0.06000000, 0.05333333, 0.96666667, 0.06666667, 0.03333333, 0.22000000, 0.04666667, 0.04666667, 0.05333333, 0.05333333, 0.05333333, 0.08000000, 0.48666667,
    0.08666667, 0.02666667, 0.21333333, 0.45333333, 0.04666667, 0.36000000, 0.06666667, 0.04000000, 0.06000000, 0.07333333, 0.06000000, 0.04000000, 0.04666667,
    0.30000000, 0.08666667, 0.07333333, 0.06666667, 0.29333333, 0.36000000, 0.17333333, 0.04000000, 0.09333333, 0.11333333, 0.03333333, 0.08000000, 0.27333333,
    0.08666667, 0.03333333, 0.04000000, 0.02666667, 0.07333333, 0.07333333, 0.02000000, 0.02666667, 0.08000000, 0.07333333, 0.02666667, 0.06666667, 0.07333333,
    0.95333333, 0.05333333, 0.04000000, 0.11333333, 0.04000000, 0.07333333, 0.06666667, 0.05333333, 0.04000000, 0.04000000, 0.06000000, 0.12666667, 0.04666667,
    0.04000000, 0.21333333, 0.05333333, 0.97333333, 0.11333333, 0.02666667, 0.04000000, 0.03333333, 0.37333333, 0.25333333, 0.06000000, 0.06000000, 0.06000000,
    0.04666667, 0.26666667, 0.98000000, 0.02000000, 0.26000000, 0.06000000, 0.05333333, 0.28000000, 0.99333333, 0.04666667, 0.02666667, 0.04000000, 0.12666667,
    0.04666667, 0.18000000, 0.03333333) 

my response variable is not at all normally distributed (kolmogorov-smirnow and shapiro test + visual checking with qqplot()) nor is the residuals of a linear model (lm()). Moreover the common assumption of homoscedasticity is not respected neither.

I've always asked a similar question but not as much accurate here. Peter Flom has suggested that I use a ordinal logistic regression (polr()) but I might not have given him enough information (he did not know the number of levels for example). What do you think ? Which model would you suggest me ? Can I make a polr() with that much levels? When I do it I actually get this:

Error message:
"Initial value "vmin" in not finite"

Notification message:
"glm.fit: fitted probabilities numerically 0 or 1 occurred "

I'm struggling on this problem for quite a long time. All your contributions are more than welcome !

$\endgroup$
4
  • 2
    $\begingroup$ Thanks. I'm not clear on what made you even entertain normality. This looks like an ideal candidate for one of the ordinal cumulative probability models such as the proportional odds model. In R you can use polr, or orm or lrm in the rms package. A case study using orm is in Chapter 15 of my Handouts. $\endgroup$ Commented Jul 25, 2013 at 11:25
  • $\begingroup$ Isn't the fact that I have more than 100 levels in my data a problem for using polr ? When I use polr on subset I don't get any error message but when I run it on the whole data set I get: "Initial value "vmin" in not finite" and this notification message: "glm.fit: fitted probabilities numerically 0 or 1 occurred " $\endgroup$
    – Sulawesi
    Commented Jul 25, 2013 at 11:31
  • $\begingroup$ @FrankHarrell In your handouts, you specify that orm is made to handle continuous variable. You also talk about log-log, complementary log-log, cauchit, probit and logit ! Knowing my variables (as described above (including the fact that I have more than 100 levels in my response variable)) which method would you suggest me ? $\endgroup$
    – Sulawesi
    Commented Jul 26, 2013 at 10:13
  • $\begingroup$ See the analysis of your data below for graphical assessments for the different distribution families. Note that your $Y$ has 41 unique values. $\endgroup$ Commented Jul 27, 2013 at 11:55

2 Answers 2

14
$\begingroup$

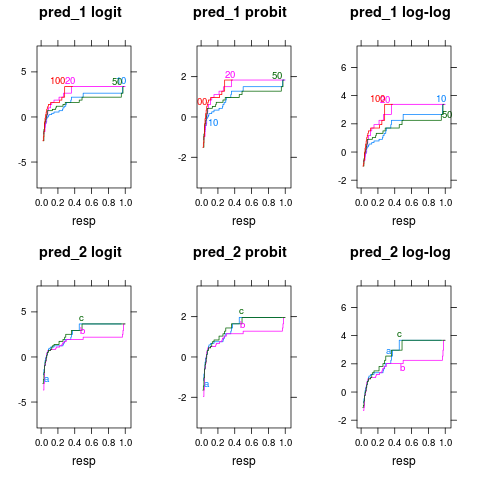
Here is an example using the R rms package orm function. The three variables are defined in the original question above. First we see which of 3 families yields the most parallelism.

require(rms)
row <- 0
for(gvar in list(pred_1, pred_2)) {
  row <- row + 1; col <- 0
  for(fun in list(qlogis, qnorm, function(y) -log(-log(y)))) {
    col <- col + 1
    print(Ecdf(~resp, groups=gvar, fun=fun,
               main=paste(c('pred_1','pred_2')[row],
                 c('logit','probit','log-log')[col])),
          split=c(col,row,3,2), more=row < 2 | col < 3)
  }
}

Examining 3 families of ordinal models

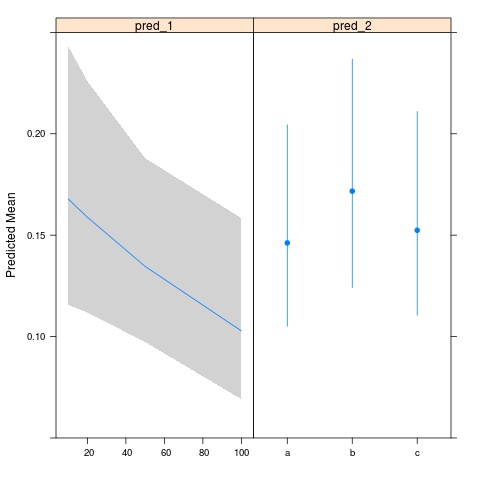
The proportional odds model does as well as any as judged by the logit transform of the ECDF. Next fit the model, assess the global null hypothesis (P=0.175) and plot predicted means. pred_1 is treated as linear.

f <- orm(resp ~ pred_1 + pred_2)
f

Logistic (Proportional Odds) Ordinal Regression Model

orm(formula = resp ~ pred_1 + pred_2)

                       Model Likelihood          Discrimination          Rank Discrim.    
                          Ratio Test                 Indexes                Indexes       
Obs             120    LR chi2      4.96    R2                  0.041    rho     0.183    
Unique Y         41    d.f.            3    g                   0.407                     
Median Y 0.06666667    Pr(> chi2) 0.1751    gr                  1.502                     
max |deriv|   2e-07    Score chi2   4.94    |Pr(Y>=median)-0.5| 0.077                     
                       Pr(> chi2) 0.1761                                                  

         Coef    S.E.   Wald Z Pr(>|Z|)
    pred_1   -0.0097 0.0046 -2.11  0.0346  
    pred_2=b  0.2822 0.3909  0.72  0.4703  
    pred_2=c  0.0734 0.3923  0.19  0.8517  

    anova(f)

                Wald Statistics          Response: resp 

 Factor     Chi-Square d.f. P     
 pred_1     4.47       1    0.0346
 pred_2     0.57       2    0.7531
 TOTAL      4.88       3    0.1809

    dd <- datadist(pred_1, pred_2); options(datadist='dd')
    bar <- Mean(f)
    plot(Predict(f, fun=bar), ylab='Predicted Mean')

Predicted means from proportional odds model

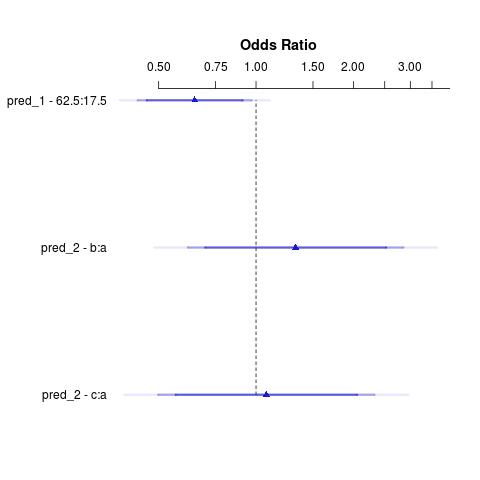
Plot predicted odds ratios. For the numeric predictor, use inter-quartile-range odds ratio.

plot(summary(f), log=TRUE)

Estimated odds ratios

$\endgroup$
4
  • 2
    $\begingroup$ I can't get a summary from f: Error in summary.rms(f) : adjustment values not defined here or with datadist for pred_1 pred_2. I'm using rms 4.4-0. $\endgroup$
    – MERose
    Commented Dec 8, 2015 at 14:29
  • 2
    $\begingroup$ Please fully read the documentation before trying to code. You'll need to run the datadist function and define the name of the object holding that result using options() before running summary or plotting. $\endgroup$ Commented Dec 8, 2015 at 16:27
  • $\begingroup$ What exactly does Mean() do here and why is it appropriate for this outcome (heteroscedastic and nonormal)? $\endgroup$ Commented Mar 29, 2016 at 7:56
  • $\begingroup$ Mean uses the $\hat{\beta}$'s and all the estimated intercepts (which forms the empirical or underlying distribution) to estimate $E(Y|X)$. It does so by computing Prob($Y=y_{j}$) for all $j$, multiplying by $y_{j}$, and adding them up. Heteroscedasticity and non-normality are handled in estimating intercept and $\beta$. $Y$ must be interval scaled for the mean to be meaningful, and the mean may be meaningful for non-normal non-heterosc. $Y$. $\endgroup$ Commented Mar 29, 2016 at 11:35
3
$\begingroup$

For regular (OLS) regression your response variable does not have to be normally distributed. The model assumes that the residuals from your model are normally distributed. You can first run regular regression and check the residuals, e.g.

m1 <- lm(resp~pred1 + pred2)
plot(m1)

This might be "good enough" but technically, since the response variable is bounded, it isn't quite right.

One method is to transform the response, e.g. by the arcsine transformation. Given that you don't have the data that made up the proportions, you can try:

library(scales)
transresp <- asn_tras(resp)

see this page for more on this method.

Another idea would be beta regression, which allows for a bounded response. R has a betareg package.

$\endgroup$
7
  • $\begingroup$ Yes, I tried several transformation but none of them succeded to give me something that looks normal (when looking at the residuals). Can a beta regression deal with values that equal 0 or 1 ? Thnks again ! $\endgroup$
    – Sulawesi
    Commented Jul 25, 2013 at 12:00
  • $\begingroup$ But maybe the ordinal logistic regression that you suggested would be fine. Can I make an ordinal ogistic regression if I have more than 100 levels in the response variable ? I get an error message but maybe it is only a issue of programmation and not of statistics $\endgroup$
    – Sulawesi
    Commented Jul 25, 2013 at 12:03
  • $\begingroup$ That's indeed what I was affraid of. So what solution do I have left ? residuals won't never be normally distributed (homoscedasticity is not respected neither). Beta regression cannot deal with 0 and 1 (if I'm not mistaken ?)...So what could I use in order to know whether pred1 or pred2 or both or the interaction has an effect on resp ? many thnks ! $\endgroup$
    – Sulawesi
    Commented Jul 25, 2013 at 12:59
  • $\begingroup$ You need no ties in $Y$ to use an ordinal model, as described in my case study. You can have $n-1$ intercepts for $n$ observations. The effective number of parameters estimated is close to 1 because of the ordering restriction on the intercepts. $\endgroup$ Commented Jul 25, 2013 at 13:06
  • 1
    $\begingroup$ 109 levels presents no problem at all other than computational. Instead of polr use the R rms package orm function which is made to handle thousands of intercepts efficiently. $\endgroup$ Commented Jul 26, 2013 at 12:00

Your Answer

By clicking “Post Your Answer”, you agree to our terms of service and acknowledge you have read our privacy policy.

Not the answer you're looking for? Browse other questions tagged or ask your own question.