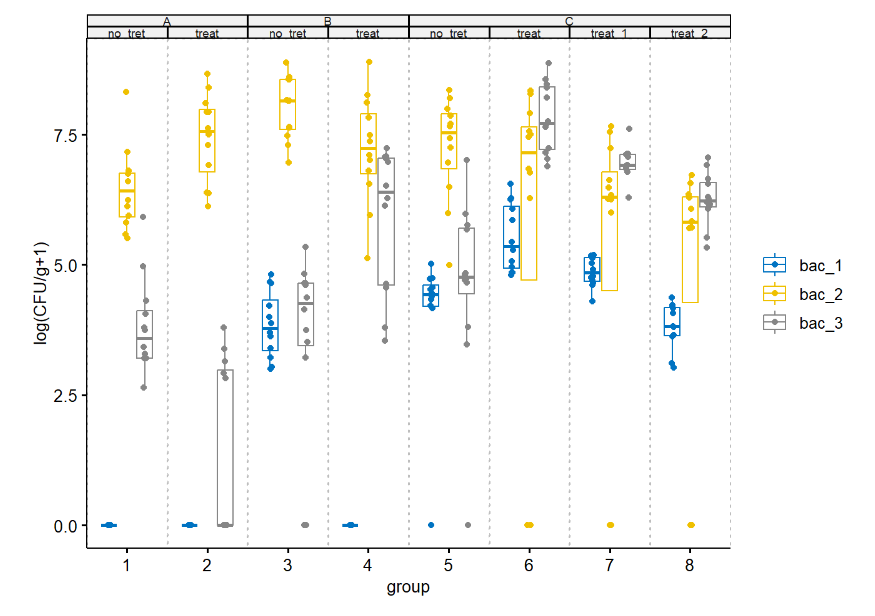
I wish test significant difference between groups from count data with zero values. I only want to compare groups with the same color (grey, yellow and blue). Some groups have only zero values which was expected, but unexpected for other groups. Other groups again have some unexpected zero values. Due to the zero values, I cannot use ANOVA test. I have come to learn that I should therefore instead apply either poisson, negative binomial, zero-inflated poisson or zero-inflated nagative binomial models. However, I am having troubles figuring out how to determine which model to apply. 
The counts are different bacteria (bac_1, bac_2 and bac_3) collected from faeces of animals after the animals were fed bacteria at the beginning of the experiment. Counts are therefore given as count/gram faeces. Zero counts can therefore be the results of bacteria not growing in the animal from the beginning or from cessation of growth by the time of collection. Some of the groups have received an identical treatment to their feed.
The figure displays log transformed data for the sake of visualisation.
Data for blue groups (bac_1) subset and including non-transformed counts:
bac_1 <- structure(list(d35_inoculum = c("A", "A", "A", "A", "A", "A",
"A", "A", "A", "A", "A", "A", "A", "A", "A", "A", "A", "A", "A",
"A", "A", "A", "A", "A", "B", "B", "B", "B", "B", "B", "B", "B",
"B", "B", "B", "B", "B", "B", "B", "B", "B", "B", "B", "B", "B",
"B", "B", "B", "C", "C", "C", "C", "C", "C", "C", "C", "C", "C",
"C", "C", "C", "C", "C", "C", "C", "C", "C", "C", "C", "C", "C",
"C", "C", "C", "C", "C", "C", "C", "C", "C", "C", "C", "C", "C",
"C", "C", "C", "C", "C", "C", "C", "C", "C", "C", "C", "C"),
    d35_treatment = c("no_tret", "no_tret", "no_tret", "no_tret",
    "no_tret", "no_tret", "no_tret", "no_tret", "no_tret", "no_tret",
    "no_tret", "no_tret", "treat", "treat", "treat", "treat",
    "treat", "treat", "treat", "treat", "treat", "treat", "treat",
    "treat", "no_tret", "no_tret", "no_tret", "no_tret", "no_tret",
    "no_tret", "no_tret", "no_tret", "no_tret", "no_tret", "no_tret",
    "no_tret", "treat", "treat", "treat", "treat", "treat", "treat",
    "treat", "treat", "treat", "treat", "treat", "treat", "no_tret",
    "no_tret", "no_tret", "no_tret", "no_tret", "no_tret", "no_tret",
    "no_tret", "no_tret", "no_tret", "no_tret", "no_tret", "treat",
    "treat", "treat", "treat", "treat", "treat", "treat", "treat",
    "treat", "treat", "treat", "treat", "treat_1", "treat_1",
    "treat_1", "treat_1", "treat_1", "treat_1", "treat_1", "treat_1",
    "treat_1", "treat_1", "treat_1", "treat_1", "treat_2", "treat_2",
    "treat_2", "treat_2", "treat_2", "treat_2", "treat_2", "treat_2",
    "treat_2", "treat_2", "treat_2", "treat_2"), d35_id = c("1_1",
    "1_2", "1_3", "1_4", "1_5", "1_6", "1_7", "1_8", "1_9", "1_10",
    "1_11", "1_12", "2_16", "2_17", "2_18", "2_19", "2_20", "2_21",
    "2_22", "2_23", "2_24", "2_25", "2_26", "2_27", "3_31", "3_32",
    "3_33", "3_34", "3_35", "3_36", "3_37", "3_38", "3_39", "3_40",
    "3_41", "3_42", "4_46", "4_47", "4_48", "4_49", "4_50", "4_51",
    "4_52", "4_53", "4_54", "4_55", "4_56", "4_57", "5_61", "5_62",
    "5_63", "5_64", "5_65", "5_66", "5_67", "5_68", "5_69", "5_70",
    "5_71", "5_72", "6_76", "6_77", "6_78", "6_79", "6_80", "6_81",
    "6_82", "6_83", "6_84", "6_85", "6_86", "6_87", "7_91", "7_92",
    "7_93", "7_94", "7_95", "7_96", "7_97", "7_98", "7_99", "7_100",
    "7_101", "7_102", "8_106", "8_107", "8_108", "8_109", "8_110",
    "8_111", "8_112", "8_113", "8_114", "8_115", "8_116", "8_117"
    ), d35_ce_group = c(1L, 1L, 1L, 1L, 1L, 1L, 1L, 1L, 1L, 1L,
    1L, 1L, 2L, 2L, 2L, 2L, 2L, 2L, 2L, 2L, 2L, 2L, 2L, 2L, 3L,
    3L, 3L, 3L, 3L, 3L, 3L, 3L, 3L, 3L, 3L, 3L, 4L, 4L, 4L, 4L,
    4L, 4L, 4L, 4L, 4L, 4L, 4L, 4L, 5L, 5L, 5L, 5L, 5L, 5L, 5L,
    5L, 5L, 5L, 5L, 5L, 6L, 6L, 6L, 6L, 6L, 6L, 6L, 6L, 6L, 6L,
    6L, 6L, 7L, 7L, 7L, 7L, 7L, 7L, 7L, 7L, 7L, 7L, 7L, 7L, 8L,
    8L, 8L, 8L, 8L, 8L, 8L, 8L, 8L, 8L, 8L, 8L), bact = c("bac_1",
    "bac_1", "bac_1", "bac_1", "bac_1", "bac_1", "bac_1", "bac_1",
    "bac_1", "bac_1", "bac_1", "bac_1", "bac_1", "bac_1", "bac_1",
    "bac_1", "bac_1", "bac_1", "bac_1", "bac_1", "bac_1", "bac_1",
    "bac_1", "bac_1", "bac_1", "bac_1", "bac_1", "bac_1", "bac_1",
    "bac_1", "bac_1", "bac_1", "bac_1", "bac_1", "bac_1", "bac_1",
    "bac_1", "bac_1", "bac_1", "bac_1", "bac_1", "bac_1", "bac_1",
    "bac_1", "bac_1", "bac_1", "bac_1", "bac_1", "bac_1", "bac_1",
    "bac_1", "bac_1", "bac_1", "bac_1", "bac_1", "bac_1", "bac_1",
    "bac_1", "bac_1", "bac_1", "bac_1", "bac_1", "bac_1", "bac_1",
    "bac_1", "bac_1", "bac_1", "bac_1", "bac_1", "bac_1", "bac_1",
    "bac_1", "bac_1", "bac_1", "bac_1", "bac_1", "bac_1", "bac_1",
    "bac_1", "bac_1", "bac_1", "bac_1", "bac_1", "bac_1", "bac_1",
    "bac_1", "bac_1", "bac_1", "bac_1", "bac_1", "bac_1", "bac_1",
    "bac_1", "bac_1", "bac_1", "bac_1"), CFU_g = c(0L, 0L, 0L,
    0L, 0L, 0L, 0L, 0L, 0L, 0L, 0L, 0L, 0L, 0L, 0L, 0L, 0L, 0L,
    0L, 0L, 0L, 0L, 0L, 0L, 16400L, 65300L, 5000L, 47000L, 4220L,
    43900L, 10000L, 2500L, 1670L, 1000L, 1100L, 7500L, 0L, 0L,
    0L, 0L, 0L, 0L, 0L, 0L, 0L, 0L, 0L, 0L, 53600L, 14500L, 0L,
    33400L, 21400L, 36700L, 16500L, 25000L, 0L, 104000L, 55300L,
    28300L, 1770000L, 720000L, 63200L, 1900000L, 270000L, 70300L,
    3540000L, 115000L, 69700L, 90000L, 193000L, 1190000L, 147000L,
    44300L, 108000L, 150000L, 133000L, 60000L, 57000L, 40900L,
    20000L, 50000L, 153000L, 81700L, 23700L, 4500L, 16700L, 4250L,
    4380L, 1070L, 1270L, 11600L, 6620L, 16000L, 6430L, 14800L
    ), CFU_g_log = c(0, 0, 0, 0, 0, 0, 0, 0, 0, 0, 0, 0, 0, 0,
    0, 0, 0, 0, 0, 0, 0, 0, 0, 0, 4.21487032861122, 4.81491983198191,
    3.69905685454767, 4.67210709814554, 3.62541535215441, 4.64247441294225,
    4.00004342727686, 3.3981136917305, 3.22297644989339, 3.00043407747932,
    3.04178731897175, 3.87511916546257, 0, 0, 0, 0, 0, 0, 0,
    0, 0, 0, 0, 0, 4.72917289212618, 4.1613979525458, 0, 4.52375946944571,
    4.33043406700971, 4.56467789772798, 4.21751026429403, 4.39795738010389,
    0, 5.01703751518718, 4.74273298466013, 4.45180178134793,
    6.24797351172585, 5.85733309961763, 4.80072394997615, 6.27875382952881,
    5.43136537265409, 4.84696150270678, 6.54900338470783, 5.06070161681095,
    4.8432390089641, 4.95424733490676, 5.28555955923242, 6.07554732634572,
    5.16732028912236, 4.6464135295996, 5.03342777671354, 5.17609415434258,
    5.12385490632685, 4.77815848856469, 4.75588247480709, 4.61173392632452,
    4.30105170984523, 4.6989786901388, 5.18469426933435, 4.91222737222182,
    4.3747666702852, 3.65330901293848, 4.2227424760266, 3.62849110496712,
    3.64157325317818, 3.02978947083186, 3.10414555055401, 4.06449542679273,
    3.82092358788132, 4.20414712521285, 3.80827850958277, 4.17029105862539
    )), class = "data.frame", row.names = c(NA, -96L))

CFU_gvalues still seem to be normalized (possibly by gram animal body weight), however, so they can't be used directly in a Poisson or negative binomial model. Use the original raw counts as the outcome values and then include an offset term in the model to deal with the per gram (or whatever) normalization. In your situation I suspect that would belog(body_weight). Also, use natural logs rather than base-10 logs when you set up the model. $\endgroup$