4
$\begingroup$

I have multiple years of data on a tree crop: yield, canopy volume, that sort of thing. There are also 2 factors (variety, management). I am trying to find out if there is a correlation between some of my variables, for example canopy and yield. I have access to a statistician who is very strict and rigorous. He has made some claims and I wonder if they are completely true and must be adhered to as closely as he suggests. Now on the other side, my boss is challenging the way the statistician wants me to do it and wants me to convince him. The claims of the statistician are:

  1. I have to center the data (subtract the year-mean from each data point and add the overall mean) to remove the year effect. My boss is not happy with this because it means the values in the scatter plot are not real values anymore and are misleading. Also, it reduces the range of the data. The canopy volume and yield went from close to zero in the early years to a high number upon tree maturity. The statistician said that if I don't centre the data, it is misleading because the yield increases due to age (ie year) rather than due to canopy. From a biological point of view, this is a little bit silly I think, but I do understand the concept.

  2. I cannot fit a regression model. The reason apparently is that my experiment has not been designed so that the explanatory variable is replicated and thus has no error. My explanatory variable (canopy) is an observation, rather than designed. He referred me to a paper (Powers 2021, Annals of Applied Biology editorial), but in the same paper it says: 'In other studies, collected data comprising pairs of observations will be investigated to consider the relationship between them without necessarily having replication in each level [as is the case in my experiment] ... It is important that the statistical quality of the proposed relationship is assessed. Firstly, in fact, it should be asked whether a fitted relationship is actually required.' This implies that a fitted model is an option, albeit not always the best choice. Whereas the statistician said it is wrong, period. He quotes a book (Applied Regression Analysis by Draper and Smith): 'an assumption of regression analysis is that the predictor variables are NOT subject to random variation'[which in my case they are]. My statistics book (Statistics. An introduction using R by Crawley) says: 'Perhaps the easiest way of knowing when regression is the appropriate analysis is to see that a scatterplot is the appropriate graphic.'[which, in my case, it definitely is] Also an important fact is that heaps of other papers in my field are doing exactly that: fitting a regression line to data such as mine. And that is the argument my boss is using: people expect to see the line and the r2 and you need to have a good reason to do it differently. The statistician is suggesting for me to use a scatterplot with a Pearson's correlation coefficient, but no line.

I feel like I am stuck between a rock and a hard place (two very strong and assertive personalities) and I need some more interpretations/opinions at my back to feel like I can argue better.

$\endgroup$

2 Answers 2

2
$\begingroup$

It's hard (and potentially dangerous) to try to infer what the fundamental objections of your statistician might be from a question like this. There certainly are some serious difficulties at least with how you would interpret the results of your proposed correlation or regression analysis with this type of time-series data.

I'd recommend that you look at Hyndman and Athanasopoulos, Forecasting: Principles and Practice (FPP) to understand the issues specific to time series (which I still approach only with trepidation).

In particular, correlations among time series can be very misleading. A classic example is how the incidence of shark attacks over time can be highly correlated with sales of ice cream. The correlation is due to both being higher in warmer weather. A few things that strike me as potentially problematic follow.

First, I suspect that the recommendation by your statistician to demean the data is to remove spurious correlations like those between shark attacks and ice cream sales. Something like that makes sense; even more aggressive pre-processing of time series data might be necessary in some cases before reliable statistical analysis is possible. See FPP; many details are beyond my expertise.

Second, I wonder if you might be over-interpreting the prohibition of regression modeling. For example, page 17 of the third edition (1998) of Draper and Smith's "Applied Regression Analysis" says (emphasis added):

By predictor variables we shall usually mean variables that can either be set to a desired value (e.g., input temperature or catalyst feed rate) or else take values that can be observed but not controlled (e.g., the outdoor humidity).

Those authors certainly seem OK with regression modeling that involves explanatory/predictor variables that are only observed rather than set by investigators. In practice, many (most?) applications of regression analysis use observed rather than pre-set predictors. See Frank Harrell's Regression Modeling Strategies (RMS) for lots of examples. Much of FPP also deals with regressions using observed variable values as predictors.

I wonder if there's some other matter that concerns your statistician (errors in measurements or correlations within study areas that require special techniques), as a strict prohibition against using observed values as predictors in models is extraordinarily extreme (and even contrary to Draper and Smith).

Third, a Pearson correlation only evaluates the linear association between two variables. Unless the association is linear it can be pretty useless, as this answer illustrates. Spearman or Kendall correlations are based on ranks and thus at least remove the strict linearity requirement.

Regression that is not linear in the predictors should be possible in this situation. The linearity of "linear regression" applies to the regression coefficients, not to the predictors themselves.

Nonlinear transformations of predictor values can often better illustrate the association between a predictor variable and an outcome variable. Draper and Smith, for example, discuss polynomial fits in Chapter 12. More recent practice supports more flexible regression splines (see Chapter 2 of RMS) or more complex generalized additive models as outlined in Chapter 7 of An Introduction to Statistical Learning by James et al.

$\endgroup$
2
  • $\begingroup$ One quick comment before I re-read and re-re-read your answer to properly understand it. My statistician said that my explanatory variable (canopy volume) is not an observation such as humidity, because it IS controlled to a certain extent - by the management treatments. So it falls between the cracks, because it can't be set to a desired value, but it can be controlled. Apparently, D&S state that “an assumption of regression analysis is that the predictor variables are NOT subject to random variation”, which in my case they are. $\endgroup$
    – Meerkat
    Commented Nov 6 at 23:51
  • $\begingroup$ @Meerkat then perhaps canopy volume is a mediator of the effects of management treatment? There is a literature and special methods devoted to mediators, which are both affected by treatments and whose treatment-associated changes account (in part, at least) for the effects of the treatment on the outcome of interest. Methods for analyzing mediation do go beyond standard regression, although regression tools are involved. $\endgroup$
    – EdM
    Commented Nov 7 at 4:02
2
$\begingroup$

controlling for year

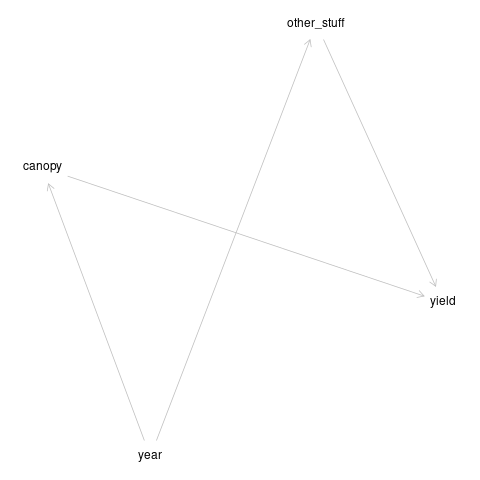
I agree with @EdM's comment that the statistician might be worried about mediation and confounding. It might help to think about a directed acylic graph:

enter image description here

(sorry about the wonky arrangement, too much trouble to fix it). In this case, if we control for year, then we are also controlling for the "other stuff" (such as overall growth) that might happen over time ...

library(dagitty)
d <- dagitty("dag{
   year -> canopy;
   other_stuff -> yield;
   year -> other_stuff;
   canopy -> yield;
  }")
plot(d)

Whether or not this particular diagram matches how you think things work, DAGs can be useful for continuing the conversation between you, your boss, and the statistician, about what kinds of assumptions you are willing to make/what kind of conclusions you can draw as a result. (Hopefully you can get your boss and the statistician in the same room so that you're not stuck as the go-between ...)

variation in covariates

On the subject of "covariates must be not be subject to random variation" (I have always heard this expressed as "must be measured without error"); measurement error will indeed bias estimated effects (usually toward zero), but it doesn't generally cause problems for model prediction. There are ways of handling errors in predictor variables, but they tend to (1) require that you be able to estimate the amount of variation/error a priori; (2) be a bit more complicated than standard regression techniques ...

$\endgroup$

Your Answer

By clicking “Post Your Answer”, you agree to our terms of service and acknowledge you have read our privacy policy.

Not the answer you're looking for? Browse other questions tagged or ask your own question.