6
$\begingroup$

I have a dataset and I made the QQ-plot against the $N(0,1)$ distribution. The plot is included below.
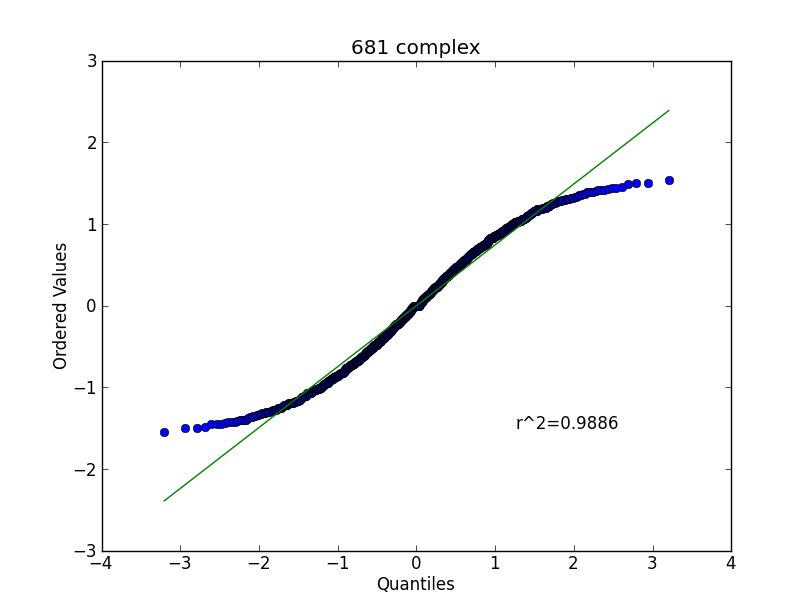
My statistics is rusty to say the least (meaning what little knowledge I had is now rusted away!) Clearly the normal distribution is not a good fit -- the tails in my data are heavier than those in a normal distribution. But the data appears not to be skewed relative to the normal distribution.

So, which distribution might be a better fit? Is it something a transformation like Box-Cox could cure to make it fit better?

Edit:

My data isn't strictly positive so Box-Cox is out... But there may be another transformation that works.

Edit 2:

I have increasingly large datasets and I need to see what, if anything, the datasets converge to. This is exploratory analysis, I would rather find a distribution that fits the data rather than transforming the data to a distribution. All of this is done with SciPy which reports the asymptotic value of the biased kurtosis as -1 and skewness as 0.

But I don't know how to use that information to determine which distribution this might be, aside from checking all of them to see which ones give a better $r^2$.

Edit 3:

Based on a comment from gung, I checked it against a uniform distribution:
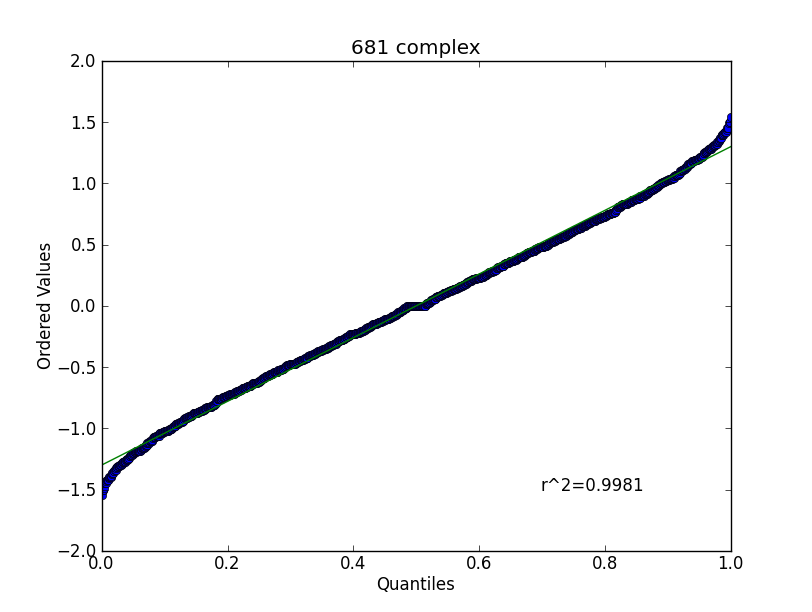
Sure enough, that's considerably better although still shows a difference in the tails.

$\endgroup$
8
  • 2
    $\begingroup$ There are lots of distributions with heavier tails than the Normal - e.g. the t-distribution (lower df has heavier tails). But what are you trying to do? Are you trying to see what distribution best fits your data? Or are you trying to find a transformation that will make your data Normal? And, whatever you are trying to do, why are you trying to do it? $\endgroup$
    – Peter Flom
    Commented Sep 25, 2013 at 23:22
  • $\begingroup$ If the data values are on the Y axis ("Ordered Values") & the theoretical quantiles are on the X axis, then the tails may be too short. I wonder if this is a uniform dist or something like that. $\endgroup$ Commented Sep 25, 2013 at 23:26
  • $\begingroup$ I updated what I'm trying to do and why. I can look at the raw data and see it converges to something, just trying to explore various ways to describe what that something is $\endgroup$
    – tpg2114
    Commented Sep 25, 2013 at 23:29
  • $\begingroup$ @gung I updated with the Uniform QQ -- it is much better. Could you elaborate on how you came up with that as an answer? And if the fit could be improved more? $\endgroup$
    – tpg2114
    Commented Sep 25, 2013 at 23:33
  • 2
    $\begingroup$ "Is it something a transformation like Box-Cox could cure" -- why should your data need to be normal? $\endgroup$
    – Glen_b
    Commented Sep 26, 2013 at 0:19

1 Answer 1

10
$\begingroup$

I'll turn my comments into an answer; I can delete this or add more if necessary.

Based on your original qq-plot, it appears to me that the tails of your distribution may be too short--at least relative to the normal distribution. (This is based on my interpretation that the data values are on the Y axis "Ordered Values" and the theoretical quantiles are on the X axis.) As a result of this, the evident symmetry, and the slight bowing in the middle, I wondered if it might be a uniform distribution or something similar. I discussed the interpretation of qq-plots here: qq-plot does not match histogram.

Edit 2 noted that the kurtosis was given as $-1$. I like this resource for thinking about kurtosis, which notes that kurtosis cannot be lower than $1$, thus SciPy has given you excess kurtosis (which is kurtosis - 3). The Wikipedia page for kurtosis lists the kurtosis for the uniform distribution as $-1$, which is consistent with my guess about the qq-plot.

Edit 3 posts a qq-plot against the uniform, which fits rather well, but the tails now seem slightly too heavy. It's worth noting that the uniform distribution is actually a special case of the beta distribution where the parameters are $(1,1)$. Thus, it's possible you have a beta that is very close to (1,1), but not actually quite (1,1) (ie, not quite uniform). Something like $(.9, .9)$, might serve as an initial guess. Of course, the validity of this hunch depends on how much data you have as to whether that slight divergence is reliable. You can read more about the beta distribution in this excellent thread: what-is-intuition-behind-beta-distribution.

$\endgroup$

Your Answer

By clicking “Post Your Answer”, you agree to our terms of service and acknowledge you have read our privacy policy.

Not the answer you're looking for? Browse other questions tagged or ask your own question.