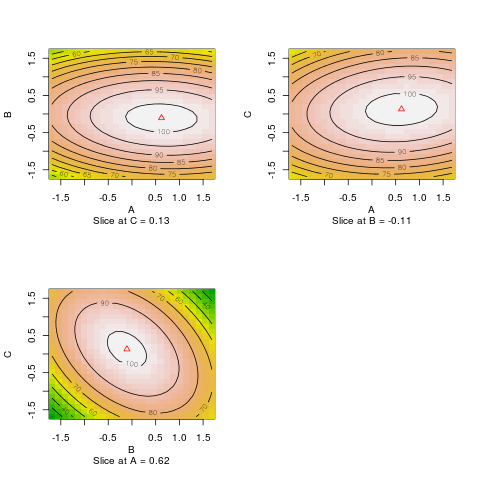
I'm intending to do a response optimization of one response, $y$, having three predictor variables, $x_1$, $x_2$, and $x_3$. These variables are coded in the following manner:
A    B   C   y
-1.00000    -1.00000    -1.00000    66
 1.00000    -1.00000    -1.00000    80
-1.00000     1.00000    -1.00000    78
 1.00000    1.00000     -1.00000    100
-1.00000    -1.00000     1.00000    70
 1.00000    -1.00000     1.00000    100
-1.00000    1.00000      1.00000    60
 1.00000    1.00000     1.00000     75
-1.68179    0.00000     0.00000     100
1.68179     0.00000      0.00000    80
0.00000    -1.68179     0.00000     68
0.00000     1.68179     0.00000     63
0.00000     0.00000     -1.68179    65
0.00000     0.00000      1.68179    82
 0.00000    0.00000      0.00000    113
0.00000     0.00000     0.00000     100
0.00000     0.00000     0.00000     118
0.00000     0.00000     0.00000     88
0.00000     0.00000    0.00000       100
0.00000     0.00000     0.00000     85
What I have tried is (in Minitab)
Stat -> DOE -> Define Custom Response Surface
And choosing 3 responses, 6 center points, 1 replicate and alpha 1,682 and subsequently choosing
Stat -> DOE -> Optimize Response variable
and choosing Maximize and lowest 100 and target 118 I got that the maximum for $y$ is
101.711
and D=0.41
but A=0.6, B = -0.11 and C=0.15
which, if I've understood correctly, is invalid for this design.
When I've googled all I see is people who merely make surface plots and conclude in what path the response is optimized - however using three variables I do not know how to perform this.

