12
$\begingroup$

I have a question about group sequential methods.

According to Wikipedia:

In a randomized trial with two treatment groups, classical group sequential testing is used in the following manner: If n subjects in each group are available, an interim analysis is conducted on the 2n subjects. The statistical analysis is performed to compare the two groups, and if the alternative hypothesis is accepted, the trial is terminated. Otherwise, the trial continues for another 2n subjects, with n subjects per group. The statistical analysis is performed again on the 4n subjects. If the alternative is accepted, then the trial is terminated. Otherwise, it continues with periodic evaluations until N sets of 2n subjects are available. At this point, the last statistical test is conducted, and the trial is discontinued

But by repeatedly testing accumulating data in this fashion, the type I error level is inflated...

If the samples were independent of one another, the overall type I error, $\alpha^{\star}$, would be

$\alpha^{\star} = 1 - (1 - \alpha)^k$

where $\alpha$ is the level of each test, and $k$ is the number of interim looks.

But the samples are not independent since they overlap. Assuming interim analyses are performed at equal information increments, it can be found that (slide 6)

enter image description here

Can you explain me how this table is obtained?

$\endgroup$

1 Answer 1

12
$\begingroup$

The following slides, through 14, explain the idea. The point, as you note, is that the sequence of statistics is correlated.

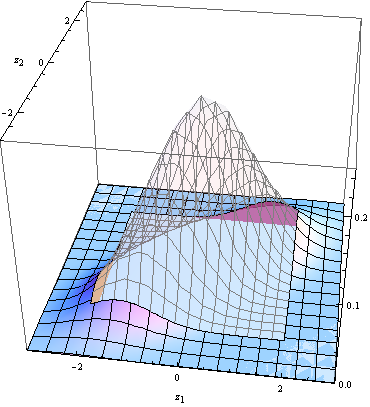
The context is a z-test with known standard deviation. The first test statistic $z_1$, suitably standardized, has a Normal(0,1) distribution with cdf $\Phi$. So does the second statistic $z_2$, but--because the first uses a subset of the data used for the second--the two statistics are correlated with correlation coefficient $\sqrt{1/2}$. Therefore $(z_1, z_2)$ has a binormal distribution. The probability of a type I error (under the null hypothesis) equals the probability that either (a) a type I error occurs in the first test or (b) a type I error does not occur in the first test but does occur in the second test. Let $c = \Phi^{-1}(1 - 0.05/2)$ be the critical value (for a two-sided test with nominal size $\alpha$ = 0.05). Then the chance of a type I error after two analyses equals the chance that $|z_1| > c$ or $|z_1| \le c$ and $|z_2| > c$. Numeric integration gives the value 0.0831178 for this probability, agreeing with the table. Subsequent values in the table are obtained with similar reasoning (and more complicated integrations).

This graphic depicts the binormal pdf and the region of integration (solid surface). Binormal PDF, 3D surface plot

$\endgroup$
4
  • $\begingroup$ Understood, thank you! Is the correlation cor(z1, z2) difficult to obtain? $\endgroup$
    – ocram
    Commented Mar 2, 2011 at 8:27
  • $\begingroup$ @Marco,The correlation is straightforward to calculate because the test statistic is so simple: it's a linear combination of normal variables. (This is because we assume the variance is known.) Alternatively, you can think of the second statistic as being a sum of two independent random variables: the first one, $z_1$, plus the change created by the additional data, $z_1 - z_2$. In more complicated cases the correlation might be quite difficult to calculate: that's one reason this somewhat idealized situation is used to motivate the sequential tests! $\endgroup$
    – whuber
    Commented Mar 2, 2011 at 8:40
  • $\begingroup$ Thank you very much. Yes, the correlation looks pretty easy to compute. Actually, it was not clear to me that the context was a comparison of the means of two normal distributions. Now, it is clear and you make everything else very clear as well! Thank you! $\endgroup$
    – ocram
    Commented Mar 2, 2011 at 8:43
  • $\begingroup$ could you provide a formula (or R code) how to calculate this for e.g. n=400? I would do this by myself but unfortunately I don't know how. And how would I have to adjust the formula if I want to calculate the overall error rate if I have multiple comparisons (e.g. comparing 4 proportions) and don't do a correction like Bonferroni and do repeated tests? Could you help me with that? $\endgroup$
    – Andreas
    Commented Feb 16, 2013 at 10:44

Your Answer

By clicking “Post Your Answer”, you agree to our terms of service and acknowledge you have read our privacy policy.

Not the answer you're looking for? Browse other questions tagged or ask your own question.