40
$\begingroup$

Simpson's paradox is a classic puzzle discussed in introductory statistics courses worldwide. However, my course was content to simply note that a problem existed and did not provide a solution. I would like to know how to resolve the paradox. That is, when confronted with a Simpson's paradox, where two different choices seem to compete for the being the best choice depending on how the data is partitioned, which choice should one choose?

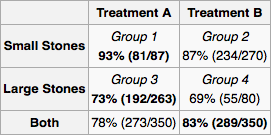
To make the problem concrete, let's consider the first example given in the relevant Wikipedia article. It is based on a real study about a treatment for kidney stones.

enter image description here

Suppose I am a doctor and a test reveals that a patient has kidney stones. Using only the information provided in the table, I would like to determine whether I should adopt treatment A or treatment B. It seems that if I know the size of the stone, then we should prefer treatment A. But if we do not, then we should prefer treatment B.

But consider another plausible way to arrive at an answer. If the stone is large, we should choose A, and if it is small, we should again choose A. So even if we do not know the size of the stone, by the method of cases, we see that we should prefer A. This contradicts our earlier reasoning.

So: A patient walks into my office. A test reveals they have kidney stones but gives me no information about their size. Which treatment do I recommend? Is there any accepted resolution to this problem?

Wikipedia hints at a resolution using "causal Bayesian networks" and a "back-door" test, but I have no clue what these are.

$\endgroup$
2
  • 3
    $\begingroup$ The Basic Simpson's Paradox link mentioned above is an example of observational data. We cannot unambiguously decide between the hospitals because the patients were probably not randomly assigned to the hospitals and the question as posed does not give us a way to know whether, for example, one hospital tended to get higher risk patients. Breaking down the results into operations A-E does not address that issue. $\endgroup$ Commented Dec 3, 2013 at 22:34
  • $\begingroup$ @EmilFriedman I agree it is true that we can unambiguously decide between hospitals. But certainly the data supports one over the other. (It is not true that the data has taught us nothing about the quality of the hospitals.) $\endgroup$
    – Potato
    Commented Dec 4, 2013 at 1:25

5 Answers 5

18
$\begingroup$

In your question, you state that you don't know what "causal Bayesian networks" and "back door tests" are.

Suppose you have a causal Bayesian network. That is, a directed acyclic graph whose nodes represent propositions and whose directed edges represent potential causal relationships. You may have many such networks for each of your hypotheses. There are three ways to make a compelling argument about the strength or existence of an edge $A \stackrel?\rightarrow B$.

The easiest way is an intervention. This is what the other answers are suggesting when they say that "proper randomization" will fix the problem. You randomly force $A$ to have different values and you measure $B$. If you can do that, you're done, but you can't always do that. In your example, it may be unethical to give people ineffective treatments to deadly diseases, or they may be have some say in their treatment, e.g., they may choose the less harsh (treatment B) when their kidney stones are small and less painful.

The second way is the front door method. You want to show that $A$ acts on $B$ via $C$, i.e., $A\rightarrow C \rightarrow B$. If you assume that $C$ is potentially caused by $A$ but has no other causes, and you can measure that $C$ is correlated with $A$, and $B$ is correlated with $C$, then you can conclude evidence must be flowing via $C$. The original example: $A$ is smoking, $B$ is cancer, $C$ is tar accumulation. Tar can only come from smoking, and it correlates with both smoking and cancer. Therefore, smoking causes cancer via tar (though there could be other causal paths that mitigate this effect).

The third way is the back door method. You want to show that $A$ and $B$ aren't correlated because of a "back door", e.g. common cause, i.e., $A \leftarrow D \rightarrow B$. Since you have assumed a causal model, you merely need to block the all of the paths (by observing variables and conditioning on them) that evidence can flow up from $A$ and down to $B$. It's a bit tricky to block these paths, but Pearl gives a clear algorithm that lets you know which variables you have to observe to block these paths.

gung is right that with good randomization, confounders won't matter. Since we're assuming that intervening at the the hypothetical cause (treatment) is not allowed, any common cause between the hypothetical cause (treatment) and effect (survival), such as age or kidney stone size will be a confounder. The solution is to take the right measurements to block all of the back doors. For further reading see:

Pearl, Judea. "Causal diagrams for empirical research." Biometrika 82.4 (1995): 669-688.


To apply this to your problem, let us first draw the causal graph. (Treatment-preceding) kidney stone size $X$ and treatment type $Y$ are both causes of success $Z$. $X$ may be a cause of $Y$ if other doctors are assigning tratment based on kidney stone size. Clearly there are no other causal relationships between $X$,$Y$, and $Z$. $Y$ comes after $X$ so it cannot be its cause. Similarly $Z$ comes after $X$ and $Y$.

Since $X$ is a common cause, it should be measured. It is up to the experimenter to determine the universe of variables and potential causal relationships. For every experiment, the experimenter measures the necessary "back door variables" and then calculates the marginal probability distribution of treatment success for each configuration of variables. For a new patient, you measure the variables and follow the treatment indicated by the marginal distribution. If you can't measure everything or you don't have a lot of data but know something about the architecture of the relationships, you can do "belief propagation" (Bayesian inference) on the network.
$\endgroup$
3
  • 2
    $\begingroup$ Very nice answer. Could you briefly say how to apply this framework to the example I give in the question? Does it give the expected answer (A)? $\endgroup$
    – Potato
    Commented Dec 5, 2013 at 1:01
  • $\begingroup$ Thanks! Do you know of a good, short introduction to "belief propagation"? I am interested in learning more. $\endgroup$
    – Potato
    Commented Dec 5, 2013 at 7:32
  • $\begingroup$ @Potato: I learned it from his book "Probabilistic Reasoning in Intelligent Systems". There are many tutorials online, but it's hard to find one that builds intuition rather than just presenting the algorithm. $\endgroup$
    – Neil G
    Commented Dec 5, 2013 at 9:01
26
$\begingroup$

I have a prior answer that discusses Simpson's paradox here: Basic Simpson's paradox. It may help you to read that to better understand the phenomenon.

In short, Simpson's paradox occurs because of confounding. In your example, the treatment is confounded* with the kind of kidney stones each patient had. We know from the full table of results presented that treatment A is always better. Thus, a doctor should choose treatment A. The only reason treatment B looks better in the aggregate is that it was given more often to patients with the less severe condition, whereas treatment A was given to patients with the more severe condition. Nonetheless, treatment A performed better with both conditions. As a doctor, you don't care about the fact that in the past the worse treatment was given to patients who had the lesser condition, you only care about the patient before you, and if you want that patient to improve, you will provide them with the best treatment available.

*Note that the point of running experiments, and randomizing treatments, is to create a situation in which the treatments are not confounded. If the study in question was an experiment, I would say that the randomization process failed to create equitable groups, although it may well have been an observational study--I don't know.

$\endgroup$
10
  • $\begingroup$ You opt for the normalization approach also suggested by the other answer. I find this problematic. It is possible to exhibit two partitions of the same data set that give different conclusions when normalized. See my link and quote in reply to the other answer. $\endgroup$
    – Potato
    Commented Dec 2, 2013 at 5:08
  • 3
    $\begingroup$ I haven't read the Stanford article. However, I don't find the reasoning in the quote compelling. It may well be that in some population, treatment B is better than treatment A. This doesn't matter. If that is true of some population, it is only because the population's characteristics are confounded. You are faced w/ a patient (not a population), & that patient is more likely to improve under treatment A w/o regard for whether that patient has large or small kidney stones. You should choose treatment A. $\endgroup$ Commented Dec 2, 2013 at 5:12
  • 2
    $\begingroup$ Is the young / old partition confounded? If not, this will not be a problem. If so, then we would use the full information to make the best decision. Based on what we know at present, the 'treatment B looks best in the aggregate' is a red herring. It only appears to be the case because of the confounding, but it is a (statistical) illusion. $\endgroup$ Commented Dec 2, 2013 at 5:22
  • 2
    $\begingroup$ You would have a more complicated table that took both kidney stone size & age into account. You can look at the Berkeley gender bias case example on the Wikipedia page. $\endgroup$ Commented Dec 2, 2013 at 5:27
  • 1
    $\begingroup$ Hate extending comments this long but...I wouldn't say that the paradox is always always due to confounding. It's due to a relationship among variables which a confounding variable will have, but I wouldn't call all variables leading to a Simpson paradox confounding (e.g. weight of 30 yr. olds and 90 yr. olds x amount of potato chips consumed per anum - because 90 yr. olds are much lighter to begin with the main effect of chips may be negative without the interaction included. I wouldn't call the age a confound though. (see first fig. on Wikipedia page.) $\endgroup$
    – John
    Commented Dec 2, 2013 at 6:32
7
$\begingroup$

This nice article by Judea Pearl published in 2013 deals exactly with the problem of which option to choose when confronted with Simpson's paradox:

Understanding Simpson's paradox (PDF)

$\endgroup$
5
$\begingroup$

One important "take away" is that if treatment assignments are disproportionate between subgroups, one must take subgroups into account when analyzing the data.

A second important "take away" is that observational studies are especially prone to delivering wrong answers due to the unknown presence of Simpson's paradox. That's because we cannot correct for the fact that Treatment A tended to be given to the more difficult cases if we don't know that it was.

In a properly randomized study we can either (1) allocate treatment randomly so that giving an "unfair advantage" to one treatment is highly unlikely and will automatically get taken care of in the data analysis or, (2) if there is an important reason to do so, allocate the treatments randomly but disproportionately based on some known issue and then take that issue into account during the analysis.

$\endgroup$
2
  • $\begingroup$ +1, however "automatically get taken care of" isn't quite true (at least in the immediate situation, which is what you primarily care about). It is true in the long run, but you still can very much have type I & type II errors due to sampling error (ie, patients in 1 treatment condition tended to have more severe diseases by chance alone). $\endgroup$ Commented Dec 3, 2013 at 22:27
  • $\begingroup$ But the effect of sampling error will be taken into account when we analyze the contingency table and calculate and properly interpret the p-value. $\endgroup$ Commented Dec 3, 2013 at 22:48
4
$\begingroup$

Do you want the solution to the one example or the paradox in general? There is none for the latter because the paradox can arise for more than one reason and needs to be assessed on a case by case basis.

The paradox is primarily problematic when reporting summary data and is critical in training individuals how to analyze and report data. We don't want researchers reporting summary statistics that hide or obfuscate patterns in the data or data analysts failing to recognize what the real pattern in the data is. No solution was given because there is no one solution.

In this particular case the doctor with the table would clearly always pick A and ignore the summary line. It makes no difference if they know the size of the stone or not. If someone analyzing the data had only reported the summary lines presented for A and B then there'd be an issue because the data the doctor received wouldn't reflect reality. In this case they probably should have also left the last line off of the table since it's only correct under one interpretation of what the summary statistic should be (there are two possible). Leaving the reader to interpret the individual cells would generally have produced the correct result.

(Your copious comments seem to suggest you're most concerned about unequal N issues and Simpson is broader than that so I'm reluctant to dwell on the unequal N issue further. Perhaps ask a more targeted question. Furthermore, you seem to think I am advocating a normalization conclusion. I am not. I am arguing that you need to consider that the summary statistic is relatively arbitrarily selected and that selection by some analyst gave rise to the paradox. I'm further arguing that you look at the cells you have.)

$\endgroup$
9
  • $\begingroup$ You claim we should ignore the summary line. Why is this "clear"? $\endgroup$
    – Potato
    Commented Dec 2, 2013 at 4:54
  • $\begingroup$ It's clear because treatment A is better with large or small stones and B only comes out because of unequal N's. Furthermore, the final line is an interpretation not gospel. There are at least two ways to calculate that line. You would only calculate it that way if you want to say something about the particular sample. $\endgroup$
    – John
    Commented Dec 2, 2013 at 4:58
  • $\begingroup$ I'm sorry, I don't understand why the summary line is an incorrect report. I think I'm missing your central point. Could you please explain? $\endgroup$
    – Potato
    Commented Dec 2, 2013 at 5:00
  • 1
    $\begingroup$ You could normalize and then average, which gives the "correct" result (A). But this illicit. The following quote is from the relevant article in the Stanford Encyclopedia of Philosophy, available here: plato.stanford.edu/entries/paradox-simpson $\endgroup$
    – Potato
    Commented Dec 2, 2013 at 5:04
  • 2
    $\begingroup$ "Simpson's Reversals show that there are numerous ways of partitioning a population that are consistent with associations in the total population. A partition by gender might indicate that both males and females fared worse when provided with a new treatment, while a partition of the same population by age indicated that patients under fifty, and patients fifty and older both fared better given the new treatment. Normalizing data from different ways of partitioning the same population will provide incompatible conclusions about the associations that hold in the total population." $\endgroup$
    – Potato
    Commented Dec 2, 2013 at 5:05

Your Answer

By clicking “Post Your Answer”, you agree to our terms of service and acknowledge you have read our privacy policy.

Not the answer you're looking for? Browse other questions tagged or ask your own question.