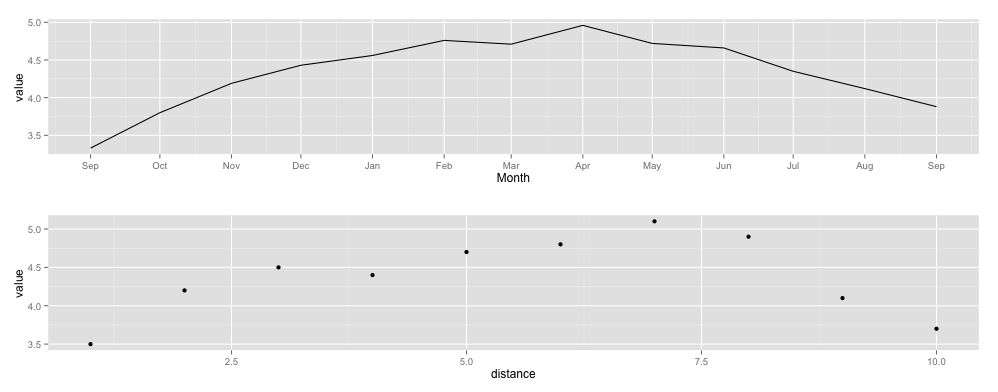
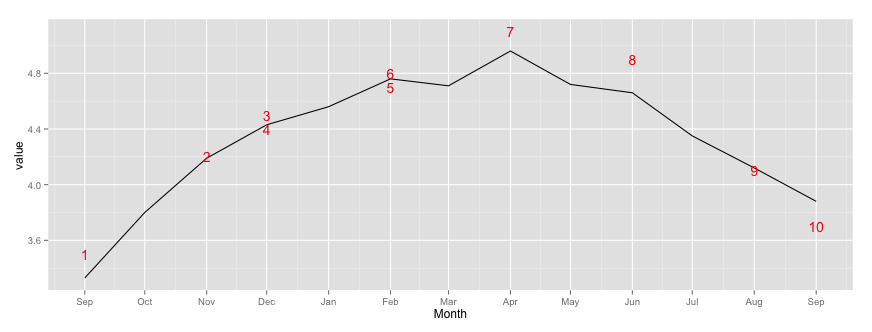
I have two datasets. The first one consist of measurements with a known date. The second dataset consists of measurements along a distance axis. The second dataset is sequentially deposited (for example an ice-core) with an unknown growth rate. Values in the two datasets are expected to match within a certain random error. An example:
curve <- data.frame(date = as.Date(c('01/09/11', '01/10/11', '01/11/11', '01/12/11', '01/01/12', '01/02/12', '01/03/12', '01/04/12', '01/05/12', '01/06/12', '01/07/12', '01/08/12', '01/09/12'), format = "%d/%m/%y"), value = c(3.33, 3.80, 4.19, 4.43, 4.56, 4.76, 4.71, 4.96, 4.72, 4.66, 4.35, 4.12, 3.88))

points <- data.frame(distance = 1:10, value = c(3.5, 4.2, 4.5, 4.4, 4.7, 4.8, 5.1, 4.9, 4.1, 3.7))

library(ggplot2)
library(scales)

a <- ggplot(curve, aes(x = date, y = value)) + geom_line() + scale_x_date(name = "Month", breaks = date_breaks("months"), labels = date_format("%b"))
b <- ggplot(points, aes(x = distance, y = value)) + geom_point()

grid.arrange(a,b,ncol=1)

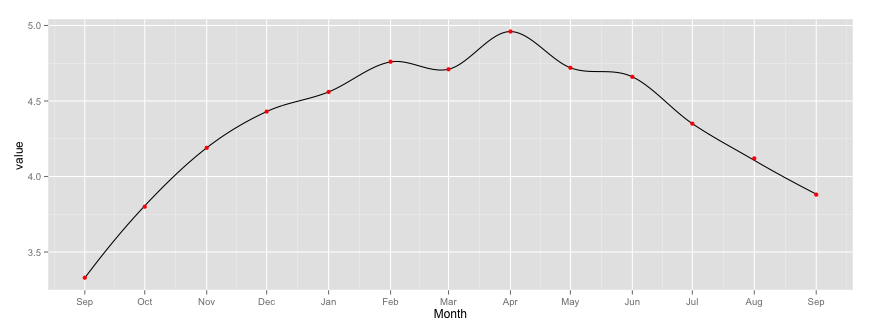
I call the dataset with known date "curve" because the number of measurements is much larger than for the dataset with a distance axis ("point" dataset). In reality both of them consist of measurement points, but I suppose I could approximate the curve dataset to an actual curve by using loess or splines. I would like to fit the "point" dataset to the "curve" dataset by changing the x-axis (or growth rate) for the "point" dataset with a constraint that the growth rate > 0 (distance between "point"s). I assume that I would be making a growth model for the distance axis.
What would be the best method to do this kind of fitting? Is there an R package developed for this kind of problem?


nlsor one of the other optimizers in R to solve for the offset to the points that would minimize the (value-value)-differences between the curve and the point-set. It would require that we know that the intervals are on the same scale. $\endgroup$