3
$\begingroup$

I start with a presumably non-stationary time series. By some criterium $k$ I extract $n_k$ pairs of times $(t_{k,i,2},t_{k,i,1})$. Now I compute the following quantity: $\bar{\tau} = \frac{1}{K} \sum_k \frac{1}{n_k} \sum_i (t_{k,i,2}-t_{k,i,1})$ What I'm looking for is the error of that quantity. I first began by summing up the variances of the "inner" mean, but I guess thats far off because of the high correlations. So I guess, somehow the autocorrelation function has to be incorporated. But as I'm not too familiar with time series, I don't even really know what to look for.

Updated with info from comments:

Here is the example of how the pairs of times are chosen:
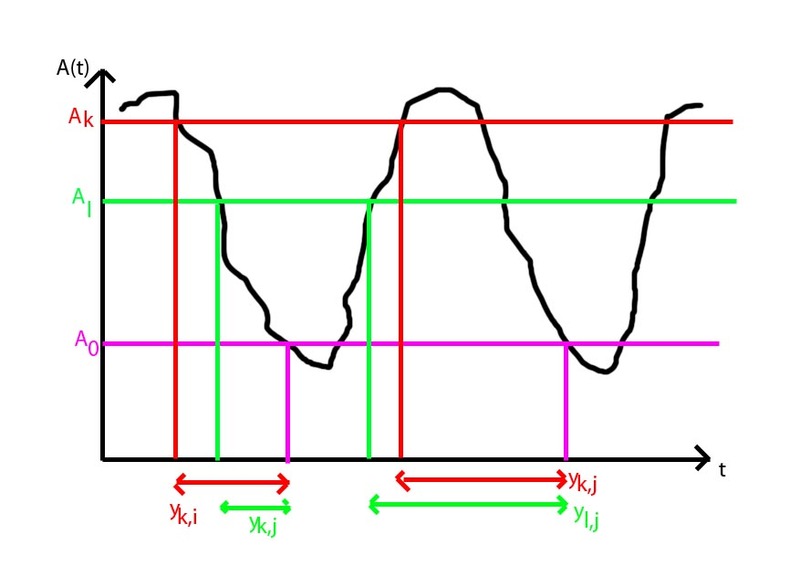
enter image description here $A(t)$ is some observed quantity. $A_k$ is an upper threshold and $A_0$ some fixed lower one $(0\notin k)$. In physics we call the $y_{ki}=t_{k,i,2}-t_{k,i,1}$ first passage times.

Edit:

I've been thinking on this for a while and I've got some ideas, but I'm not sure. First I came up with this (acv is the autocovariance function): $\sigma^2(\bar\tau) = \frac{1}{K^2}\sum_{\forall t_{k_1,i_1,j_1}, \forall t_{k_2,i_2,j_2}} a(j_1,j_2) \frac{1}{n_{k_1} n_{k_2}} acv(|t_{k_1,i_1,j_1}-t_{k_2,i_2,j_2}|)$. $a(j_1, j_2)$ is supposed to be some function that is -1 if either of the arguments is 1 (meaning that the corresponding $t$ is subtracted in the formula in my original post).

But I don't see that this reduces to $\sigma^2(\bar\tau) = \frac{1}{K^2}\sum_k\frac{1}{n_k^2}\sigma_k^2$, which was my original guess assuming no correlation. $\sigma_k^2$ denotes the variance of the $k$th "inner mean". So finally I thought about something like this: $\sigma^2(\bar\tau) = \frac{1}{K^2}\sum_k\frac{1}{n_k^2}\sigma_k^2 + \frac{1}{K^2}\sum_{\forall t_{k_1,i_1,j_1}, \forall t_{k_2,i_2,j_2}, t_{k_1,i_1,j_1}\neq t_{k_2,i_2,j_2}} a(j_1, j_2) \frac{1}{n_{k_1} n_{k_2}} acv(|t_{k_1,i_1,j_1}-t_{k_2,i_2,j_2}|)$

Can you help me? Am I thinking at least in the right direction? Thanks, Julius

$\endgroup$
4
  • $\begingroup$ are you trying to compute $Var(\bar \tau)$? Do you want explicit expression, i.e. formula, or the algorithm for numerical computation? What are the properties of process $t_{k,i}$? $\endgroup$
    – mpiktas
    Commented Mar 8, 2011 at 12:39
  • $\begingroup$ @mpiktas Yes, I'm interested in $Var(\bar\tau)$. And both an explicit formula or some numerical algorithm would be fine. What I have is a time series $A(t)$, where I compute the time between two thresholds $A_k$ and $A_0$, thats what I mean by $(t_{k,i,2}−t_{k,i,1})$, $i$ meaning the i-th time this two-threshold-crossing occurs for a given $k$. In my case that's protein folding dynamics. I checked for stationarity in R by adf.test and actually, my time series are stationary. What other properties do you think of? Thanks for your efforts. $\endgroup$
    – Askan
    Commented Mar 10, 2011 at 11:06
  • $\begingroup$ I've updated the question with the graph from the comments, since it is very relevant here. Please check that I did this correctly. $\endgroup$
    – mpiktas
    Commented Mar 10, 2011 at 15:09
  • $\begingroup$ Edit your question rather than add answers, of course unless a situation when you came up with the solution. $\endgroup$
    – user88
    Commented Mar 10, 2011 at 15:53

1 Answer 1

1
$\begingroup$

First let us introduce notation $y_{ki}=t_{k,i,2}-t_{k,i,1}$. Then $\bar\tau=\frac{1}{K}\sum_k\frac{1}{n_k}\sum_iy_{ki}$. The variance then is

\begin{align} Var(\bar\tau)&=E(\bar\tau-E\bar\tau)^2=E\left(\frac{1}{K}\sum_k\frac{1}{n_k}\sum_i(y_{ki}-Ey_{ki})\right)^2\\ &=E\frac{1}{K^2}\sum_k\sum_l\frac{1}{n_kn_l}\sum_i\sum_jcov(y_{ki},y_{lj}) \end{align}

Now the question is what can you say about $cov(y_{ki},y_{lj})$ which converted to original notation is $cov(t_{k,i,2}-t_{k,i,1},t_{l,j,2}-t_{l,j,1})$. If they are not correlated when $k\neq l$ or $i\neq j$ then the variance is simply

\begin{align} Var(\bar\tau)=\frac{1}{K^2}\sum_k\frac{1}{n_k^2}\sum_i\sigma_{ki}^2. \end{align}

I would be careful to employ stationarity. Your process has 2 indexes, when stationarity is usually defined for single indexed processes. When you have single index there is natural order of the observations $t_1<t_2<...$ and stationarity means that if you fix times $t_1<...<t_k$ then vectors $(X_{t_1},...,X_{t_k})$ and $(X_{t_1+h},...,X_{t_k+h})$ behave similarly for every shift $h$. If the index is two-dimensional there is no natural order, also shifting is now two-dimensional so there is no one clear way how to define stationarity.

So what process exactly you observe and how $t_{k,i}$ is chosen from it?

$\endgroup$
1
  • $\begingroup$ I made a little drawing of what I'm computing: img109.imageshack.us/i/mfpa.jpg I hope that is of help to you. A(t) is some observed quantity. $A_k$ is an upper threshold and $A_0$ some fixed lower one ($0 \not\in k$). In physics we call the $y_{ki}$ first passage times. So I would say that there are high correlations for $k \neq l$, probably the correlations for $i \neq j$ are not so important. So computing this $cov(y_{ki},y_{kl})$ is in fact the problem. And thanks for the insight in stationarity. $\endgroup$
    – Askan
    Commented Mar 10, 2011 at 15:01

Your Answer

By clicking “Post Your Answer”, you agree to our terms of service and acknowledge you have read our privacy policy.

Not the answer you're looking for? Browse other questions tagged or ask your own question.