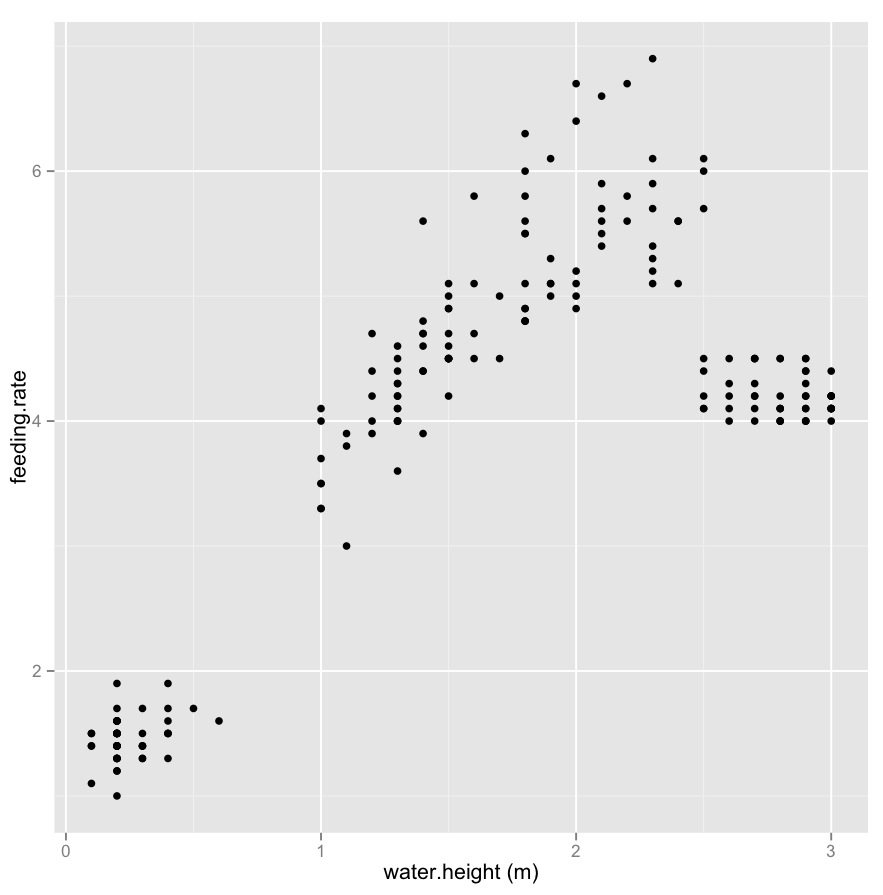
I have a predictor variable (water height in metres) and a response variable (feeding rates of birds). The relationship between them looks similar that shown in the plot below.
tidal_effect <- iris[,3:4]
library(plyr); tidal_effect <- rename(tidal_effect, c("Petal.Length" = "feeding.rate", "Petal.Width" =  "water.height"))

tidal_effect_extra <- data.frame(water.height = sample(seq(2.5, 3, 0.1), 50, replace = T), feeding.rate = sample(seq(4, 4.5, 0.1), 50, replace = T))

tidal_effect_extra <- rbind(tidal_effect, tidal_effect_extra)

library(ggplot2)
ggplot(tidal_effect_extra, aes(water.height, feeding.rate)) + geom_point() + xlab("water.height (m)")

I'm considering cutting water height into a three level factor. As can be seen in plot above, the obvious point at which to cut water height is about 0.7, 2.5 and 3, which means that the distance between the minimum/maximum values at each level of the factor are not equal
I can cut the predictor variable like this:
tidal_effect_extra$water.height.cut <- cut(tidal_effect_extra$water.height, breaks = c(0, 0.7, 2.5, 3), labels = c("low", "mid", "high"))
And then perform this model:
lm(feeding.rate ~ water.height.cut, tidal_effect_extra)
My question: is there anything wrong with cutting water height into groups in which distances between the minimum/maximum values at each level of the factor are not equal?
