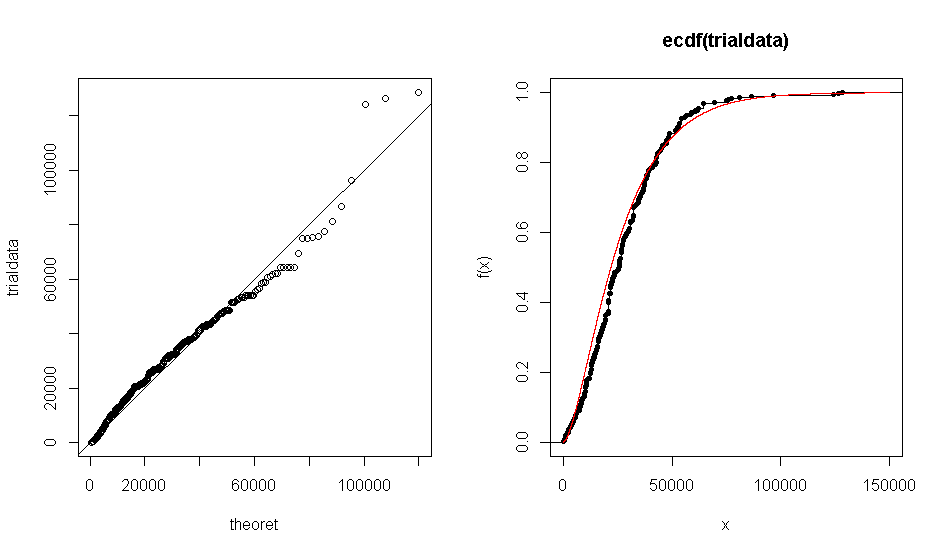
I'm trying to determine if my dataset of continuous data follows a gamma distribution with parameters shape $=$ 1.7 and rate $=$ 0.000063.
The problem is when I use R to create a Q-Q plot of my dataset $x$ against the theoretical distribution gamma (1.7, 0.000063), I get a plot that shows that the empirical data roughly agrees with the gamma distribution. The same thing happens with the ECDF plot.
However when I run a Kolmogorov-Smirnov test, it gives me an unreasonably small $p$-value of $<1\%$.
Which should I choose to believe? The graphical output or the result from KS-test?

