3
$\begingroup$

I have two paired samples and I am running a paired Mann-Whitney test to determine whether they are different. In Matlab, this takes the form of p = signrank(x,y), which tests the null hypothesis that x-y comes from a population of median zero.

Unfortunately, Matlab doesn't give difference estimates for x-y or confidence intervals for this estimate.

In the past, to estimate the shift estimate for nonpaired samples, I used the Hodges-Lehmann estimate (see Difference of 'centers' of 2 non-normal samples with Mann-Whitney test & http://en.wikipedia.org/wiki/Hodges%E2%80%93Lehmann_estimator). This is essentially the median of all pairwise differences.

Here, since the samples are paired, I imagine that the HL estimate is incorrect. Intuitively, I was thinking of using the median of all paired differences.

In either case, my question is how to get the difference estimate for x-y and the confidence interval for that estimate.

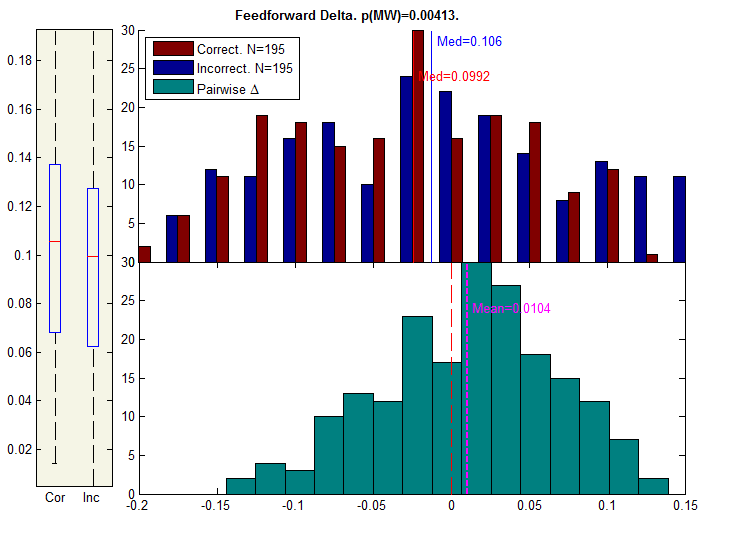
Below is a picture of my data:

The top histogram shows both samples (correct & incorrect), the bottom histogram shows the pairwise differences. A boxplot of the data is on the right. The estimated p-Value for the paired MW test is above & is <.05. Thus the data is significantly difference with correct > incorrect (even though it admittedly is hard to see on the histogram. Any suggestions on how to make it more visualisable are greatly appreciated!)
data

$\endgroup$
6
  • 1
    $\begingroup$ The wikipedia article you linked has the definition both for one- ($n$) and two- ($m, n$) sample cases. The one-sample case applies to paired differences. That is, the answer for your case (median of pairwise averages) is already discussed in the article you link to. $\endgroup$
    – Glen_b
    Commented Jan 17, 2014 at 23:32
  • $\begingroup$ See also this. Software will produce an interval for you, for example, as R's signed rank test (wilcox.test performed on a single sample) does. The procedure is essentially equivalent to adding a shift to one sample until the test statistic hits the upper and lower critical value; the limits of that shift are the limits for the interval (there are faster calculations) $\endgroup$
    – Glen_b
    Commented Jan 17, 2014 at 23:49
  • $\begingroup$ A discussion of that general approach to intervals is here for a different test. Some displays for the pair differences are discussed here. Also see the pair of displays here. I should also have mentioned, the test is properly called the Wilcoxon signed rank test. $\endgroup$
    – Glen_b
    Commented Jan 17, 2014 at 23:53
  • $\begingroup$ Another pair of displays is here $\endgroup$
    – Glen_b
    Commented Jan 17, 2014 at 23:55
  • 1
    $\begingroup$ Gentlemen, I'm sorry, but I can't seize it: how Mann-Whitney test can ever be used for paired samples. $\endgroup$
    – ttnphns
    Commented Jan 18, 2014 at 9:13

2 Answers 2

3
$\begingroup$

One can construct a confidence interval for the median difference using Walsh averages. It does assume that the distribution of the differences is symmetric, but it seems to be OK here. See this document for an explanation of the procedure. It appears that somebody even wrote a Matlab function for this calculation.

EDIT: implementation in Matlab The psignrank function in R calculates the cumulative distribution of the Sign-rank test statistic. If Matlab does not have that function, then you probably can't easily calculate an exact confidence interval. However you can calculate an approximate interval as described here. I think that is the calculation attempted at the end of the Matlab code.

$\endgroup$
1
  • $\begingroup$ Thanks Aniko, this was very useful. I am trying to implement the R code in Matlab. I get stuck on how to replicate the function 'psignrank'. What exactly does this function do? Do you know any referances which describe the whole method or this function in greater detail? (PS: the Matlab code provided has no help file and did not work for me...) $\endgroup$ Commented Jan 19, 2014 at 21:57
-2
$\begingroup$

The paired Mann-Whitney test is a rank based test. Little wonder why it's difficult to interpret and visualize the results of such a test when a T test would have been much superior. Nonetheless, just as you'd visualize paired t-test results, you can apply similar methods for rank tests. The visualization for paired t-tests works by plotting values from pre/post on separate 0/1 scales on the x-axis with continuous responses on the y-axis. You can draw lines between pre/post values.

For rank tests, all you do is convert the y-axis to a rank. Draw lines between ranks. See how many on average appear to fall upward vs downward in the groups.

$\endgroup$
3
  • $\begingroup$ I'm not seeing how this answers the main question, which was how to get the difference estimate for x-y and the associated confidence interval. I also don't agree that a T test is much superior to a paired Mann-Whitney test, unless you're referring to the visualization aspects of it. $\endgroup$
    – jbowman
    Commented Jan 17, 2014 at 22:34
  • $\begingroup$ I'm not attributing that comment to you, I personally feel rank based statistics rarely (if ever) answer a question that anyone is interested in. Nonetheless, if you want the actual point estimate and confidence interval for the Mann-Whitney, just transform your data into ranks and use a T-test. $\endgroup$
    – AdamO
    Commented Jan 17, 2014 at 22:40
  • 1
    $\begingroup$ Ah, a philosophical rather than a technical point! I'm OK with that. You might want to move your last sentence, or a variant of it, into your answer, just to expand it some. $\endgroup$
    – jbowman
    Commented Jan 17, 2014 at 22:43

Your Answer

By clicking “Post Your Answer”, you agree to our terms of service and acknowledge you have read our privacy policy.

Not the answer you're looking for? Browse other questions tagged or ask your own question.