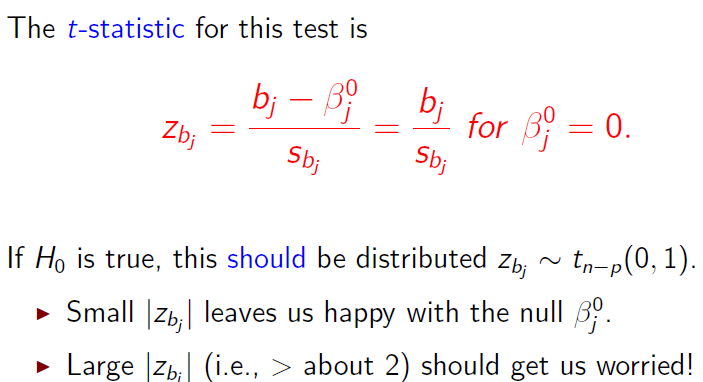
I'm trying to figure out how to interpret the ftest in 1.2(iv) of the attached sheet. What is the alternative hypothesis being assumed, and what is the null hypothesis being assumed?
Is the interpretation here that, given the t-value from the F-test, there is a chance that this value is not the real mean?

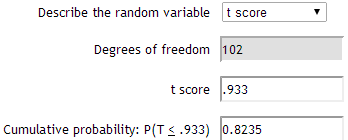
An online T calculator seems to show that there is about a 10% chance of seeing a value smaller than -.933, and approx 10% chance of seeing a value greater than .933, standard errors from the mean.

Doesn't this mean that there is more than a 10% chance that the proposed value of .1 is the right value, and that we should reject the null?
Thanks.
You're correct, I did mix up the null and alternative. In addition, the formula from the notes shows the null is the subtracted value in the numerator which would have tipped me off if i saw it earlier.
