10
$\begingroup$

I've heard a bit about using neural networks to forecast time series.

How can I compare, which method for forecasting my time-series (daily retail data) is better: auto.arima(x), ets(x) or nnetar(x).

I can compare auto.arima with ets by AIC or BIC. But how I can compare them with neural networks?

For example:

   > dput(x)
 c(1774, 1706, 1288, 1276, 2350, 1821, 1712, 1654, 1680, 1451, 
 1275, 2140, 1747, 1749, 1770, 1797, 1485, 1299, 2330, 1822, 1627, 
 1847, 1797, 1452, 1328, 2363, 1998, 1864, 2088, 2084, 594, 884, 
 1968, 1858, 1640, 1823, 1938, 1490, 1312, 2312, 1937, 1617, 1643, 
 1468, 1381, 1276, 2228, 1756, 1465, 1716, 1601, 1340, 1192, 2231, 
 1768, 1623, 1444, 1575, 1375, 1267, 2475, 1630, 1505, 1810, 1601, 
 1123, 1324, 2245, 1844, 1613, 1710, 1546, 1290, 1366, 2427, 1783, 
 1588, 1505, 1398, 1226, 1321, 2299, 1047, 1735, 1633, 1508, 1323, 
 1317, 2323, 1826, 1615, 1750, 1572, 1273, 1365, 2373, 2074, 1809, 
 1889, 1521, 1314, 1512, 2462, 1836, 1750, 1808, 1585, 1387, 1428, 
 2176, 1732, 1752, 1665, 1425, 1028, 1194, 2159, 1840, 1684, 1711, 
 1653, 1360, 1422, 2328, 1798, 1723, 1827, 1499, 1289, 1476, 2219, 
 1824, 1606, 1627, 1459, 1324, 1354, 2150, 1728, 1743, 1697, 1511, 
 1285, 1426, 2076, 1792, 1519, 1478, 1191, 1122, 1241, 2105, 1818, 
 1599, 1663, 1319, 1219, 1452, 2091, 1771, 1710, 2000, 1518, 1479, 
 1586, 1848, 2113, 1648, 1542, 1220, 1299, 1452, 2290, 1944, 1701, 
 1709, 1462, 1312, 1365, 2326, 1971, 1709, 1700, 1687, 1493, 1523, 
 2382, 1938, 1658, 1713, 1525, 1413, 1363, 2349, 1923, 1726, 1862, 
 1686, 1534, 1280, 2233, 1733, 1520, 1537, 1569, 1367, 1129, 2024, 
 1645, 1510, 1469, 1533, 1281, 1212, 2099, 1769, 1684, 1842, 1654, 
 1369, 1353, 2415, 1948, 1841, 1928, 1790, 1547, 1465, 2260, 1895, 
 1700, 1838, 1614, 1528, 1268, 2192, 1705, 1494, 1697, 1588, 1324, 
 1193, 2049, 1672, 1801, 1487, 1319, 1289, 1302, 2316, 1945, 1771, 
 2027, 2053, 1639, 1372, 2198, 1692, 1546, 1809, 1787, 1360, 1182, 
 2157, 1690, 1494, 1731, 1633, 1299, 1291, 2164, 1667, 1535, 1822, 
 1813, 1510, 1396, 2308, 2110, 2128, 2316, 2249, 1789, 1886, 2463, 
 2257, 2212, 2608, 2284, 2034, 1996, 2686, 2459, 2340, 2383, 2507, 
 2304, 2740, 1869, 654, 1068, 1720, 1904, 1666, 1877, 2100, 504, 
 1482, 1686, 1707, 1306, 1417, 2135, 1787, 1675, 1934, 1931, 1456)

Using auto.arima:

y=auto.arima(x)
plot(forecast(y,h=30))
points(1:length(x),fitted(y),type="l",col="green")
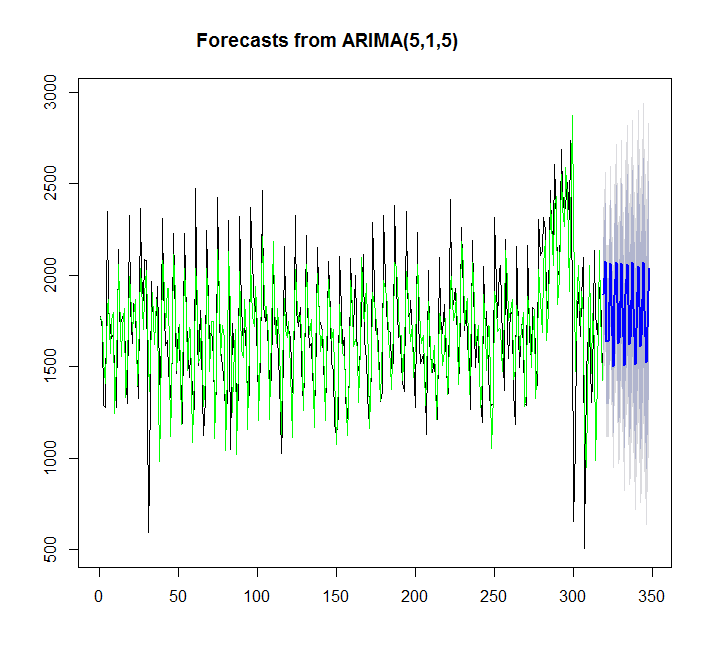
enter image description here

> summary(y)
Series: x 
ARIMA(5,1,5)                    

Coefficients:
         ar1      ar2     ar3      ar4      ar5      ma1     ma2      ma3     ma4      ma5
      0.2560  -1.0056  0.0716  -0.5516  -0.4822  -0.9584  1.2627  -1.0745  0.8545  -0.2819
s.e.  0.1014   0.0778  0.1296   0.0859   0.0844   0.1184  0.1322   0.1289  0.1388   0.0903

sigma^2 estimated as 58026:  log likelihood=-2191.97
AIC=4405.95   AICc=4406.81   BIC=4447.3

Training set error measures:
                   ME     RMSE      MAE       MPE     MAPE      MASE
Training set 1.457729 240.5059 173.9242 -2.312207 11.62531 0.6157512

Using ets:

fit <- ets(x)
plot(forecast(fit,h=30))
points(1:length(x),fitted(fit),type="l",col="red")
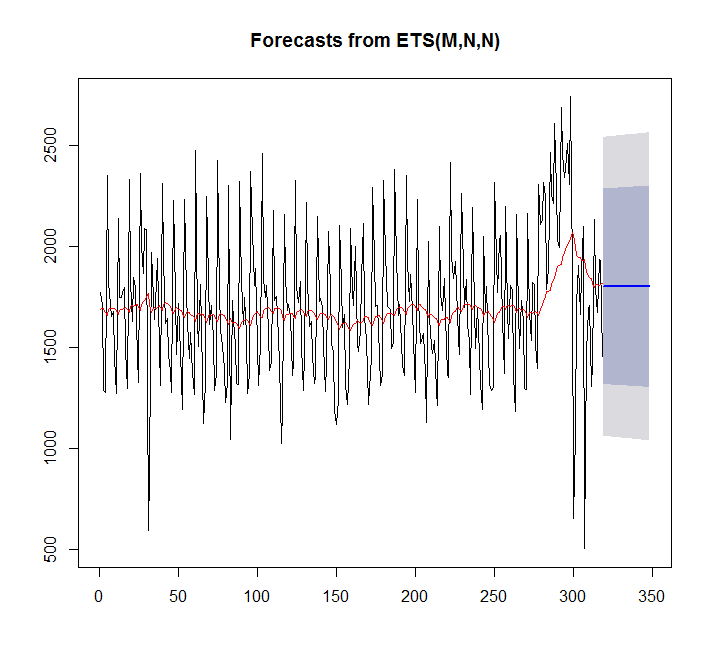
enter image description here

 > summary(fit)
 ETS(M,N,N) 

 Call:
  ets(y = x) 

   Smoothing parameters:
     alpha = 0.0449 

   Initial states:
     l = 1689.128 

   sigma:  0.2094

      AIC     AICc      BIC 
 5570.373 5570.411 5577.897 

 Training set error measures:
                    ME     RMSE      MAE      MPE     MAPE      MASE
 Training set 7.842061 359.3611 276.4327 -4.81967 17.98136 0.9786665

In this case auto.arima fits better then ets.

Let's try sing neural network:

 library(caret)
 fit <- nnetar(x)
 plot(forecast(fit,h=60))
 points(1:length(x),fitted(fit),type="l",col="green")

enter image description here

From the graph, I can see, that neural network model fits quite well, but how can I compare it with auto.arima/ets? How can I compute AIC?

Another question is, how to add confidence interval for neural network,if it is possible, like it is added automatically for auto.arima/ets.?

$\endgroup$

4 Answers 4

14
$\begingroup$

In-sample fits are not a reliable guide to out-of-sample forecasting accuracy. The gold standard in forecasting accuracy measurement is to use a holdout sample. Remove the last 30 days from the training sample, fit your models to the rest of the data, use the fitted models to forecast the holdout sample and simply compare accuracies on the holdout, using Mean Absolute Deviations (MAD) or weighted Mean Absolute Percentage Errors (wMAPEs).

Here is an example using R. I am using the 2000th series of the M3 competition, which already is divided into the training series M3[[2000]]$x and the test data M3[[2000]]$xx. This is monthly data. The last two lines output the wMAPE of the forecasts from the two models, and we see here that the ARIMA model (wMAPE 18.6%) outperforms the automatically fitted ETS model (32.4%):

library(forecast)
library(Mcomp)

M3[[2000]]

ets.model <- ets(M3[[2000]]$x)
    arima.model <- auto.arima(M3[[2000]]$x)

ets.forecast <- forecast(ets.model,M3[[2000]]$h)$mean
arima.forecast <- forecast(arima.model,M3[[2000]]$h)$mean

sum(abs(ets.forecast-M3[[2000]]$xx))/sum(M3[[2000]]$xx)
sum(abs(arima.forecast-M3[[2000]]$xx))/sum(M3[[2000]]$xx)

In addition, it looks like there are abnormally high sales near indices 280-300. Could this be Christmas sales? If you know about calendar events like these, it would be best to feed those to your forecasting model as explanatory variables, which will give you a better forecast next time that Christmas rolls around. You can do that easily in ARIMA(X) and NNs, not so easily in ETS.

Finally, I recommend this textbook on forecasting: http://otexts.com/fpp/

$\endgroup$
7
  • $\begingroup$ Thank you for the answer. Your suggestions are very good, but unfortunately they don't fit for me. I have lots of time-series, with different periods and I need to do forecasting for them, therefore I'm looking for a simple and best model. I thought, that if I could compare methods by AIC, then I will choose the best one. $\endgroup$
    – Jurgita
    Commented Mar 13, 2014 at 8:22
  • $\begingroup$ I can't look for each time serie manually, I should write a program, that would find the best model and apply it $\endgroup$
    – Jurgita
    Commented Mar 13, 2014 at 8:23
  • $\begingroup$ is it possible to add explanatory variables(Christmas days) to auto.arima forecasting model? Or it is possible only when working with arima? $\endgroup$
    – Jurgita
    Commented Mar 13, 2014 at 8:29
  • 1
    $\begingroup$ You can write a loop over your series and look which method gives the best wMAPE for each series. If one method clearly outperforms the others, use that one for all series. Otherwise, think about using different methods per series. AIC won't help you with multiple series! Or, even better, look for dedicated software for forecasting large numbers of daily retail time series that also takes things like price changes etc. into account. This is what I do for a living, I'll happily put you in contact with our salespeople ;-) But I'll also be happy to assist you here! $\endgroup$ Commented Mar 13, 2014 at 8:29
  • $\begingroup$ For auto.arima(), use the xreg parameter. See ?auto.arima. $\endgroup$ Commented Mar 13, 2014 at 8:31
4
$\begingroup$

Stephan's suggestion above is a good one. I would add that using AIC is definitely a valid way to choose within models--but not among them. I.e., you can (and should!) use information criteria to choose which ARIMA model(s), which exponential smoothing model(s), etc., and then compare your top candidates using out of sample prediction (MASE, MAPE, etc.).

http://robjhyndman.com/hyndsight/aic/

$\endgroup$
1
$\begingroup$

Watch this video by Prof Rob https://www.youtube.com/watch?v=1Lh1HlBUf8k

In the video, Prof Rob taught regarding the accuracy function and the differences between in sample accuracy and out of sample accuracy.

i.e: Taking say 80-90% of your data, fit a model, forecast. Then check accuracy using the forecasted data with the 10% (since we have the actual value of your 10% data, we can check the out of sample accuracy of the model )

As well as refer to the online textbook in otext

Like other mentioned, when we compare models vs models, we use the accuracy() to compare with the test set. Then you can have various error measure like MAE, MSE, RMSE... etc which are used to compare models vs models

$\endgroup$
0
0
$\begingroup$

Instead of giving name fit to NN model use fit_nn. Similarly, fit_arima and fit_ets. so that you can compare all models.

library(caret)
#ets
fit_ets <- ets(x)
#ANN
fit_nn <- nnetar(x)
plot(forecast(fit,h=60))
points(1:length(x),fitted(fit_nn),type="l",col="green")
library(forecast)
accuracy(fit_nn)
accuracy(fit_ets)

now, you can compare both models using ME, MAE or whatever you want.

$\endgroup$
4
  • $\begingroup$ I had to read this a couple of times to get your point. While the naming of the variables is good coding practice, it's not central to the answer. The main part of your answer is in the final line (using MAE, etc). If you could highlight (or even better, expand on) that, it would improve this. $\endgroup$
    – mkt
    Commented Aug 28, 2019 at 7:04
  • $\begingroup$ when you use function accuracy(model), it gives certain statistics like ME, MAE, RMSE, MPE and so on. You can use any of them or all to compare two or more models. Say for instance, model with least RMSE(Root Mean Square Error) is considered as the best model among all. $\endgroup$ Commented Aug 28, 2019 at 9:46
  • $\begingroup$ That is helpful to know. But my point is that this is not a site about coding, even though code can certainly illuminate questions and answers. And so your answer would be better if you highlighted the substantive issue. $\endgroup$
    – mkt
    Commented Aug 28, 2019 at 9:51
  • $\begingroup$ The question was how can ANN be compared with statistical models like ARIMA (since these models are compared using their AIC values) and the answer is using other statistical values like MAE or RMSE which can be obtained by accuracy() function. There is no point of confusion in it. $\endgroup$ Commented Aug 28, 2019 at 10:43

Your Answer

By clicking “Post Your Answer”, you agree to our terms of service and acknowledge you have read our privacy policy.

Not the answer you're looking for? Browse other questions tagged or ask your own question.