2
$\begingroup$

I have two lots of samples: one is the control lot and the other undergoes some treatment. I did three measurements for the samples: one at the initial time (T1) and the other two later.

           Descriptive Statistics               
    Lot         Mean  Std. Deviation      N
T1  1.00    124.3043         3.21127     23
    2.00    124.1333         1.94286     30
    Total   124.2075         2.54467     53
T2  1.00    112.8261         5.81262     23
    2.00    107.7000         7.42387     30
    Total   109.9245         7.18398     53
T3  1.00    90.3478          8.47783     23
    2.00    114.7000         4.43458     30
    Total   104.1321        13.77852     53

The plotted data look like this:
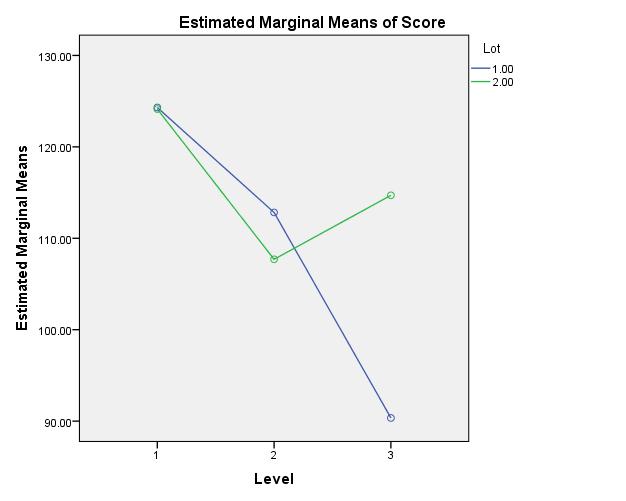
enter image description here

What I did:

Use IBM SPSS (ver 20) and run General Linear Model/Repeated Measures. Established the factor to MeasureTime with three levels and the measurement. Between subjects factor was set to the lot number (1 or 2), Model full factorial, Contrasts to MeasureTime, Simple, Reference category set to first.

SPSS output a lot of statistics. Almost all are relevant (sig < 0.000) except Mauchly's Test of Sphericity.

What I want to know:

  1. How can I see if the mean differences in T1/T2/T3 are significant? (I expect that T1 is not and T3 is.)
  2. What statistic (from SPSS output) tells me that the treatment works?

P.S. I read other related questions suggested by Stack Exchange, but no luck with my questions.

I think that ANOVA would work for a factor with multiple levels, but as I read on other questions, in case of repeated measurements, ANOVA assumptions fail. The data are not independent.

$\endgroup$

1 Answer 1

2
$\begingroup$

Since, Mauchly's Test supports the Sphericity assumption you should read and report Sphericity Assumed calculations.

You have a significant effect of Level on the values of Score if you see a statistically significant result at the row Level in the table Tests of Within-Subjects Effects of the SPSS output.

You have a significant effect of treatment on the values of Score if you see a statistically significant result at the row Lot (or whatever the name of this variable) in the table Tests of Between-Subjects Effects of the SPSS output.

For post hoc comparison in repeated measures: Actually, it seems that SPSS does not offer a specific post hoc test for repeated measures ANOVA and the reason probably is that the repeated measures are dependent thus not appropriate for those methods. A workaround is to apply 3 paired samples t - test between all combinations of $T_i$ and $T_j$ making a correction for p, that is considering a statistically significant result when $p < \alpha / 3$, instead of $p < \alpha$.

Hope this will help you.

$\endgroup$
2
  • $\begingroup$ Thanks for the answer! I'll read it carefully and see if I understand everything :) $\endgroup$
    – visoft
    Commented Apr 3, 2014 at 11:07
  • 1
    $\begingroup$ You welcome. Additionally, I guess you observe a significant interaction effect between Level and Lot (row Level*Lot in table Tests of Within-Subjects Effects) a statistical result that corresponds to the fact that Lot groups are changing their score in a different way in time (a remark that is strongly supported from the line plot). $\endgroup$ Commented Apr 3, 2014 at 15:21

Your Answer

By clicking “Post Your Answer”, you agree to our terms of service and acknowledge you have read our privacy policy.

Not the answer you're looking for? Browse other questions tagged or ask your own question.