6
$\begingroup$

I am testing the normality of a sample with R using qqnorm. I obtain this:
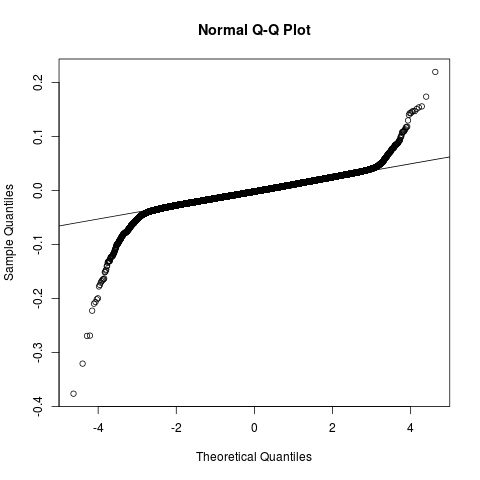
Normal Q-Q plot

I understand that the meaning of this plot is that the sample has fat tails. But what is the meaning of the values on the $x$ axis? Are they standard deviations? Are they quantiles?

If they are standard deviations, I understand that more than 99% of points follow quite nicely a normal distribution. If they are quantiles, I can only say that for 2/3 of the points. However, it looks really nice here:

Histogram vs Normal distribution

$\endgroup$

1 Answer 1

2
$\begingroup$

The x-coordinate of the points is the value this point would have if it were drawn from the standard normal distribution (preserving it's current quantile). That is to say, if it currently is at the median of the sample, it's corresponding value in the standard normal distribution would be 0 (2.5th percentile would be at -1.96, and so on).

The units are just numbers. Because this is the standard normal distribution, it just coincides with the standard deviation.

$\endgroup$

Your Answer

By clicking “Post Your Answer”, you agree to our terms of service and acknowledge you have read our privacy policy.

Not the answer you're looking for? Browse other questions tagged or ask your own question.