4
$\begingroup$

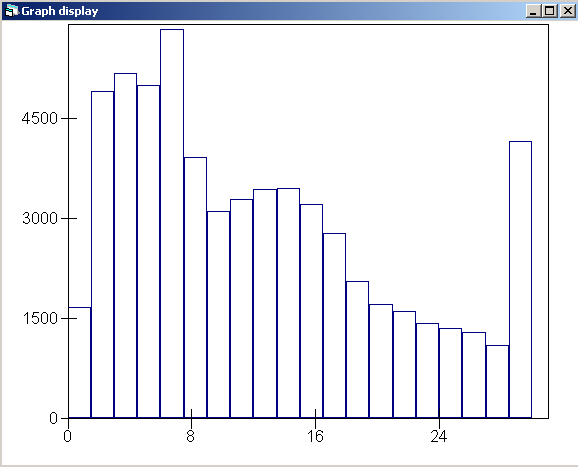
The broadband speed data I'm working with have all values over 30Mbps placed into a >30 category. The distribution is thus truncated. This leads to the final column in the histogram below being a catch-all for any values above this point. I've been advised to remove the final column. I'm tyring to develop a multilevel model which uses a variety of economic and socio economic varaibles at the postcode level and above.

Can anyone suggest a method to help me smooth out this spike in the distribution please? Is it possible to estimate the distribution of this variable above this cut off point?
enter image description here

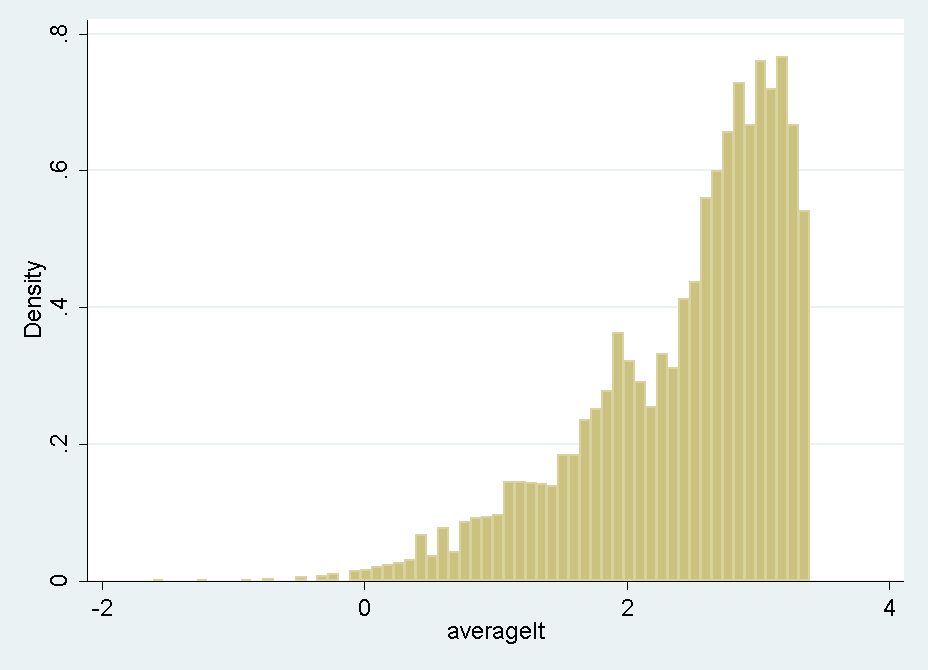
Edit: After removing the final column of the distribution and log transforming the data, I still end up with a distribution like the histigram below. Can anyone advise any techniques on how I could better deal with this truncated distribution please?
enter image description here

$\endgroup$

1 Answer 1

2
$\begingroup$

If one looks at that histogram (conventionally, not "histograph") and has the information that "over 30" is just lumped together, the mind can doodle and imagine it smoothed out somehow. Perhaps the pattern of frequencies in the values just above looks roughly exponential.... Except: There isn't a spell straight from Hogwarts that can just fix what was broken in data production or collection.

  1. What else do you want to do if you manage to do this? Answers will depend on what you say.

  2. There should be more context than you give, and it's got to be important. What are these values? Is any value above 30 possible in principle? Is there an upper limit on what is physically (biologically, economically, etc.) possible? I doubt that any person with a lot of statistical experience would feel that there will be an answer to the question, independent of subject-matter knowledge. If there's some theory for the form of the tail of the distribution, or other datasets on the same variable, they might help a bit, but the territory is still dangerous.

  3. Is there no other information on these cases? Perhaps there is scope for more kind of multiple imputation using other variables as predictors. But, if you follow that road, expect to do a lot of reading, a lot of computing, and to have to think quite differently about your data. (In particular, no method can infallibly provide correct values when none was collected in the first place.)

  4. If you were to smooth that out, what's the implication? That the values over 30 get assigned different values? Which gets assigned what? That's got to be arbitrary, but see #3 again.

  5. Plenty of fields use special methods when values are censored or truncated at an upper (or lower) limit. The best strategy might to work with the limit, not to try to fudge beyond it.

  6. It is usually impractical, but any short list still has to mention that the ideal possibility is to go out again and get better data.

  7. In some problems of this kind, one answer is to fit a truncated gamma, or truncated lognormal, or some other brand-name distribution, truncated. But in your case it is already apparent from the bimodality that no simple distribution is a good candidate. Except (see #2 again) there just may be an idea that your distribution is a mixture and can be modelled as such.

$\endgroup$

Your Answer

By clicking “Post Your Answer”, you agree to our terms of service and acknowledge you have read our privacy policy.

Not the answer you're looking for? Browse other questions tagged or ask your own question.