1
$\begingroup$

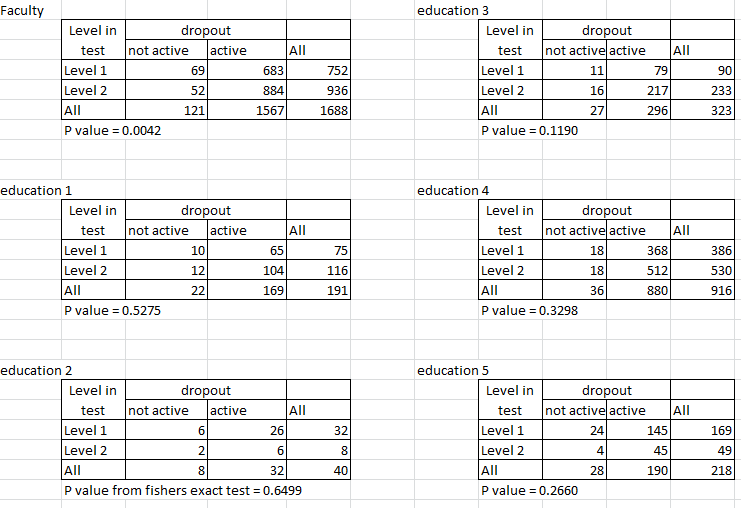
I'm making a chi square test on data that has information about students. I want to find out whether there is a relationship between how well the students did on a particular test and the level of dropout from education. I have a 2×2 matrix with the variables Level in test which takes the values level 1 and level 2, and the variable dropout which has the values not active and active.

I have performed a chi square test for independence on a whole faculty (n = 1688) and the p value = 0.0042, indicating that there is a difference between students in level 1 and 2 in relation to their dropout. But when I perform the same analysis on each of the 5 educations in the faculty, I get the p values (0.5275, 0.6499, 0.1190, 0.3298, 0.2660). These individual conclusions are that there is no difference in students in level 1 and level 2 in relation to dropout. Are these conflicting conclusions? What should I trust? (See attached data.) Thank in advance for the help!

enter image description here

$\endgroup$
7
  • $\begingroup$ Is ''education' ordered? $\endgroup$
    – Glen_b
    Commented Jun 19, 2014 at 10:12
  • $\begingroup$ (i) since your subgroups have smaller samples, even if they all shared the same effect size you wouldn't expect them to have a similar p-value to the aggregate. (ii) Also see Simpson's paradox. $\endgroup$
    – Glen_b
    Commented Jun 19, 2014 at 10:14
  • $\begingroup$ No education is not ordered. So because of the subgroups have so small samples, I can not trust the conclusion of the p value? $\endgroup$ Commented Jun 19, 2014 at 10:23
  • $\begingroup$ Pass/fail or level 1 or 2 is crude data. You might want to use more detailed information from the tests, namely the actual numeric scores on the test. When you use the numeric scores, your statistical tests will be more powerful and you will be more likely to find statistical significance in your separate analyses, if there is a real effect in each of them. If there is no real effect in them, you are not more likely to find statistical significance. (This approach will shed some light on whether you have an instance of Simpson's paradox, as well.) $\endgroup$
    – Joel W.
    Commented Jun 19, 2014 at 13:56
  • $\begingroup$ I don't have the test score, so I have to use the level 1 and level 2. $\endgroup$ Commented Jun 20, 2014 at 13:01

1 Answer 1

1
$\begingroup$

For the five levels of education the log odds ratio is 0.29, -0.37, 0.64, 0.33, 0.62 and combining them using a fixed effects meta-analysis yields an overall summary of 0.40 with 95% confidence interval from -0.00 to 0.81. In odds ratio terms this is 1.50 (1.00 to 2.23) whereas the analysis of the collapsed table yields 1.72 (1.16 to 2.55).

The issue here looks much more like one of sample size than of Simpson's paradox although there is some limited heterogeneity between the education levels.

$\endgroup$

Your Answer

By clicking “Post Your Answer”, you agree to our terms of service and acknowledge you have read our privacy policy.

Not the answer you're looking for? Browse other questions tagged or ask your own question.