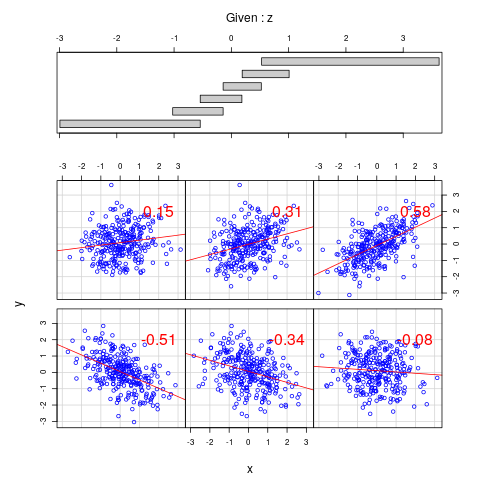
I would like to know if it is possible to create a scatterplot while controlling for covariates, such as in partial correlation. I am using R software and my code is below for the basic scatterplot.
I am not interested in multiple lines of best fit or multiple scatters per graph. I am also not interested in creating a lattice of scatterplots with all of the variables.
I can't seem to find any code that will allow me to parse the effect of the covariates from my x-y scatterplot. All three covariates are continuous. Any ideas would be helpful.
plot(pmc$reject, pmcp$LPA, main="r(Parenting, Left Amygdala)",
    xlab="Parenting Age 2", ylab="Amygdala Reactivity Age 15", pch=19)
abline(lm(pmc$reject ~ pmcp$LPA), col="red") # regression line (y~x)


predict(). $\endgroup$