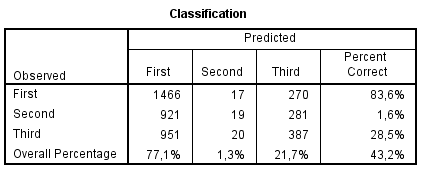
I am running a multinomial logistic regression with SPSS and I have encountered a problem (?) with my data. I have a dependent variable (DV) with three categories, five independent variables (IV) as factors and four IVs as covariates. There are close to 4800 respondents in the data.
The distribution of my DV is: First category (40,6 %), second category (28,1 %), third category (31,3 %).
As I run the regression (last category as the reference), the classification table shows that only 1,3 % percent are classified in the second category. See below:

I have tried to find some solution to this dilemma, and the only thing I have come up is that the model is just not a good one considering the classification. The results of the logistic model otherwise seem "reliable", though.
Does anybody have any idea of what might be wrong or what could be done alternatively to this problem? Any help would be much appreciated!
Best regards

second categoryare in the centre of the observations that are labelledfirst categoryso there is no straight line that can divide the two. Try running a decision tree and have a look at what the confusion matrix looks like. You can read this $\endgroup$