1
$\begingroup$

My data set is an annual panel data set on individual income, the year of unemployment and a number of demographic variables. I run an OLS regression of the form

$y_{it} = \sum _{j=1} ^n D_{j,it} \beta_j + \sum_k x_k\delta_k + u_{it},$

where $y$ denotes income and $D_1,...,D_n$ are $n$ mutually exclusive dummy variables which represent the timing of unemployment. They are mutually exclusive because unemployment occurs exactly once. If, for example, $D_1$=1 and all other dummies equal 0, then the individual was unemployed 1 year earlier. The other covariates are denoted by $x_k,k=1,...,K$, which are all dummy variables as well. In addition, $i$ denotes individuals, $t$ denotes time. After the estimation I construct the variable

$c = \frac{\hat{\beta_3}-\hat{\beta_2}}{\bar{y}}$

where $\hat{\beta_j}$ is the parameter estimate associated with $D_j$, and $\bar{y}$ is the mean predicted value of $y$ for those who have $D_2 = 1$. Note that $\hat{\beta_3}-\hat{\beta_2}$ denotes the estimated difference in income between having become unemployed 2 relative to 3 years earlier. In addition, $\bar{y}$ is predicted income for individuals who became unemployed 2 years earlier. Hence, $c$ is the estimated percentage change in income from 2 to 3 years after unemployment.

My question is: How do I construct the variance of $c$? I guess the variance of the numerator must be $var(\hat{\beta_2})+var(\hat{\beta_3})-2covar(\hat{\beta_2},\hat{\beta_3})$ - but how do I construct the variance of the whole thing?

$\endgroup$
3
  • $\begingroup$ Variances of ratios can be tricky! In particular, if $\bar{y}$ can be zero there is obvious problems. If the probability that $\bar{y}$ is close to zero is so small that can be neglected, you could try bootstrapping (or simulation). In that case you could also try the "delta method", that is, a linear taylor approximation and then calculate the variance in that linear approximation. But if $\bar{y}$ can be close to zero, that can be very wrong. For a better answer, we need more details. Give us much more information about your data and model! $\endgroup$ Commented Aug 6, 2014 at 9:03
  • $\begingroup$ @kjetilbhalvorsen Thank you! I added a few details to the post. Since I have no experience with bootstrapping I would like to use the delta method. It looks like I would need the covariance between $\bar{y}$ and $\hat{\beta_2}$ and $\hat{\beta_3}$, respectively. Do you have any suggestion how to compute this? $\endgroup$
    – Katarina
    Commented Aug 6, 2014 at 10:11
  • $\begingroup$ You can read about the method here: en.wikipedia.org/wiki/Delta_method $\endgroup$ Commented Aug 6, 2014 at 11:07

1 Answer 1

1
$\begingroup$

$\DeclareMathOperator{\var}{var} \DeclareMathOperator{\cov}{cov} $ I will give some details of a solution using the delta method. First, read about the delta method in http://en.wikipedia.org/wiki/Delta_method

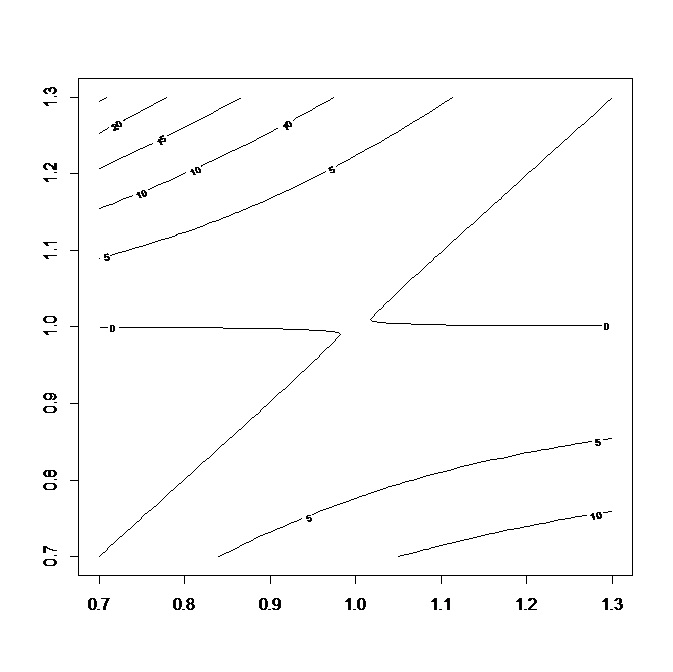
Define the function $f(x,y)=x/y$. We calculate the first order taylor expansion around the point $(x_0. y_0)$ as: $$ f_1(x,y) = x_0/y_0 + \frac1{y_0} (x-x_0) - \frac{x_0}{y_0^2} (y-y_0) $$ It can be usefull to have an idea of the percent error you are doing in using this approximation! I will illustrate that by choosing $x_0=y_0=1.0$ and letting $x\in [0.7, 1.3], y \in [0.7, 1.3]$. Following is R code for making a contour plot:

> f  <-  function(x,y)  x/y
> f1  <-  function(x,y,x0=1, y0=1) f(x0,y0)+(1/y0)*(x-x0) - (x0/y0^2)*(y-y0)
> X  <-  Y  <-  seq(0.7, 1.3, by=0.01)
> Z  <-  outer(X,Y,FUN=function(x,y) 100 * ((f(x,y)-f1(x,y))/f(x,y)))
> contour(X,Y,Z)

This results in the following contour plot: enter image description here

You could do it yourself (with ranges relevant for your situation) to see if the percent error is acceptable!

To use this, let $x=\hat{\beta_3}-\hat{\beta_2}, x_0 = \beta_3-\beta_2, y=\bar{y} , y_0=y (\text{that is, the true but unknown value})$ and calculate the variance in this linear approximation:
$$ \begin{align} \var(\frac{\hat{\beta_3}-\hat{\beta_2}}{\bar{y}} &\approx (\frac{1}{\bar{y}})^2 \var(\hat{\beta_3}-\hat{\beta_2}) + (\frac{\hat{\beta_3}-\hat{\beta_2}}{\bar{y}^2})^2 \var(\bar{y}) - \\ &2\cdot \frac1{\bar{y}}\cdot \frac{\hat{\beta_3}-\hat{\beta_2}}{\bar{y}^2}\cdot \cov(\hat{\beta_3}-\hat{\beta_2}, \bar{y}) \end{align} $$ Now, $\bar{y}$ shoudl be a linear combination of data times coefficients, so you should be able to compute its variance from the covariance matrix of the coefficients estimates, which should be part of output. Likewise for $ \cov(\hat{\beta_3}-\hat{\beta_2}, \bar{y}) $.

You could do a simulation study to see if this approximation is good enough!

$\endgroup$

Your Answer

By clicking “Post Your Answer”, you agree to our terms of service and acknowledge you have read our privacy policy.

Not the answer you're looking for? Browse other questions tagged or ask your own question.