5
$\begingroup$

I am trying to fit a bivariate cluster model with X and Y. What I would like to do is discard (make not clustered / un-grouped) that are far from the cluster center (for example $\mu$ + 2*standard deviation) at each direction.

X2 <- c(rnorm(150, 10, 1),rnorm(50, 10, 5),  rnorm(150, 25,1),
    rnorm(50, 25, 20), rnorm(200,35,1),  rnorm(200,80,1), rpois(50,30))
Y2 <- c(rnorm(800, 30, 2), rpois(50,30))
df <- cbind (X2, Y2)
plot(df, pch = 20, col = "gray40", ylim = c(15,45), xlim = c(-10, 90))
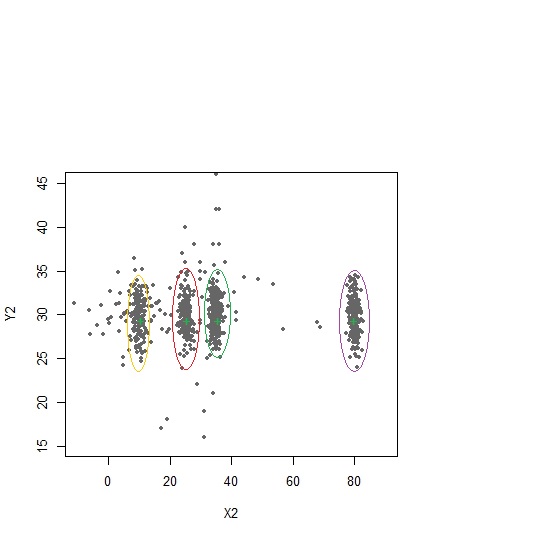
enter image description here

I am expecting 4 clusters here and I would like to group only those inside ellipse that has high probability (say with in $\mu$ + 2*standard deviation in both X and Y) and make rest un-grouped.

Here is what tried with mixture model:

require(mixtools)
out <- mvnormalmixEM(df, lambda = NULL, mu = NULL, sigma = NULL, k = 4,
 arbmean = TRUE, arbvar = TRUE, 
           epsilon = 1e-08,  maxit = 10000, verb = FALSE)
plot(out, density = TRUE, alpha = c(0.01, 0.05, 0.10, 0.12, 0.15), 
 marginal = TRUE)

I do not know how to put such threshold here.
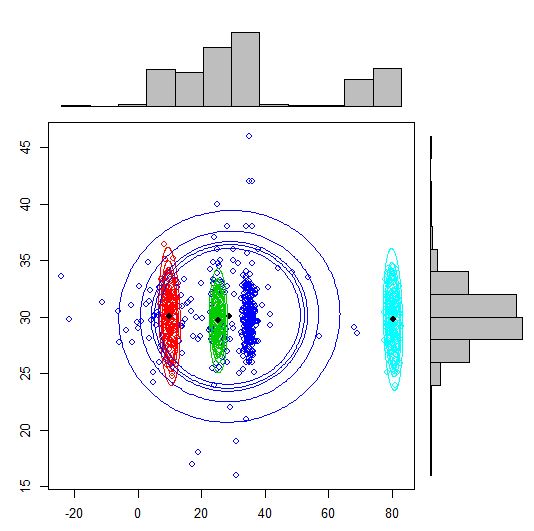
enter image description here

$\endgroup$
1

1 Answer 1

2
+50
$\begingroup$

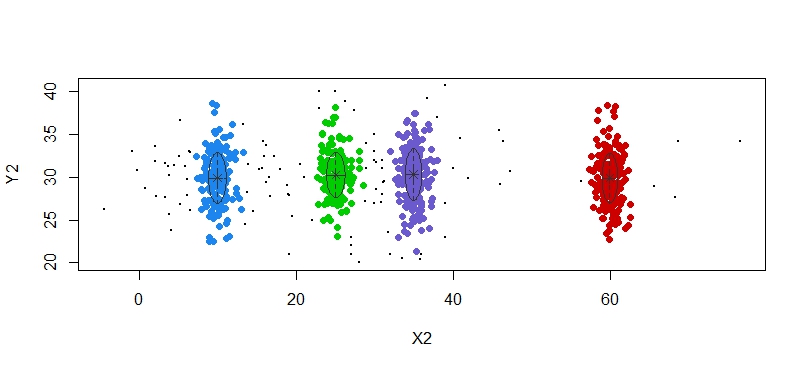
Here is solution using mixture model using package mcluster. The idea is provide prior outliers that fits the criteria of mean of Y or X variable plus twice sd of X or Y variable.

 X2 <- c(rnorm(150, 10, 1),rnorm(50, 10, 5),  rnorm(150, 25,1),
    rnorm(50, 25, 20), rnorm(200,35,1),  rnorm(200,60,1), rpois(50,30))
Y2 <- c(rnorm(800, 30, 3), rpois(50,30))
df <- cbind (X2, Y2)
plot(df, pch = 20, col = "gray40", ylim = c(15,45), xlim = c(-10, 90))

mean and variance calculation:

Xvar = sd(X2)
Xmean <- mean(X2)
Yvar = sd(Y2)
Ymean = mean (Y2))

Now identifying potential outliers:

noiseINIT <- X2 > (Xmean + Xvar*2) & Y2 >(Ymean + Yvar*2)

Here note that variation is not for particular cluster variance rather global mean and variance, not within each cluster.

dfbic <- mclustBIC(df,G=4,
initialization = list(noise = noiseINIT))

dfsummary <- summary(dfbic, df)
dfsummary
mclust2Dplot(df, classification=dfsummary$classification,
parameters=dfsummary$parameters,  symbols = 18)

enter image description here

If you would like do pre-cluster and find mean and covariance for noise prediction, you can do so using mixtools as follows:

require(mixtools)
out <- mvnormalmixEM(df, lambda = NULL, mu = NULL, sigma = NULL, k = 4,
 arbmean = TRUE, arbvar = TRUE, epsilon = 1e-08,  maxit = 10000, verb = FALSE)
    out$mu 

[[1]]
[1] 10.03088 29.73584

[[2]]
[1] 23.25702 30.02964

[[3]]
[1] 34.92314 29.87429

[[4]]
[1] 59.86794 29.77950


out$sigma
[[1]]
           [,1]       [,2]
[1,]  0.9130767 -0.2981406
[2,] -0.2981406  7.4559937

[[2]]
           [,1]      [,2]
[1,] 100.751791 -1.319039
[2,]  -1.319039 12.157087

[[3]]
          [,1]      [,2]
[1,] 0.9950905 0.7062686
[2,] 0.7062686 8.8444094

[[4]]
           [,1]       [,2]
[1,]  1.0882691 -0.4201116
[2,] -0.4201116  9.4550932
$\endgroup$

Your Answer

By clicking “Post Your Answer”, you agree to our terms of service and acknowledge you have read our privacy policy.

Not the answer you're looking for? Browse other questions tagged or ask your own question.