I am very new to statistics, and have searched around the net and stack exchange for an answer, and have tried to guess how to deal with the problem. Therefore this post. I hope someone can help...
I am carrying out an analysis of the environmental impact of about 100 parametrically generated external wall constructions. For each variant, I have results for primary energy, greenhouse gases, acidification, etc.; 10 different parameters in all.
Architects are not very good at numbers, so we are looking at creating a guidance method that reduces the amount of data that architects need to look at early in the design process. I want to see whether there is enough correlation between the parameters, so that instead of looking at 10 parameters to see which construction is best, architects only need to look at 2 or 3 parameters.
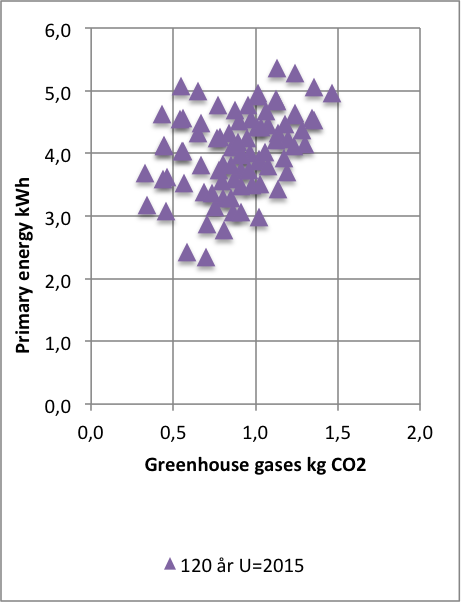
Here is the graph for primary energy in relation to greenhouse gases:

How do I deduce whether there is a correlation in Excel? What is the exact work flow?
I have done the following:
1: test for skewness on both datasets (SKEW); If the result is greater than 1.0, then a constant of 1.0 is added to the data and it is converted to Log10. I have not figured out how to treat the dataset if the skew is less than -1.0.
2: Pearson r test (CORREL) is carried out. If r>0.75 then there is correlation.
3: R2 test (RSQ) is carried out. If R2>0.56 then there is correlation.
4: LINEST test is carried out to calculate whether F.DIST.RT is less than 5%, and whether m/sem is less than TINV. This is to calculate the 5% probability.
I have the following questions:
1) Is this correct? Am I missing something?
2) Are the thresholds for r/R2 (0.7/0.56) I have chosen correct to show correlation?
3) Is the SKEW/log10 approach correct, and how do I deal with negative skewness?
4) Is there an easier way to do it by dividing the two datasets into each other and looking at the ratio, standard deviation, variance, etc.
Help would be greatly appreciated!
Rob
