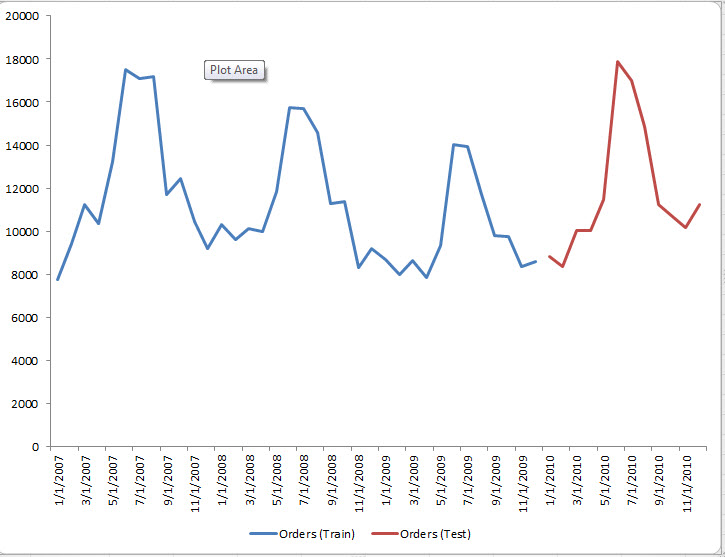
Some exploratory data analysis:
In summarizing your data at the monthly level, I noticed you have couple of issues going on in your data.
- In the test period data which begins at January 2010 there is a
significant "bending upwards" of trend.
- In addition I also see there is a high degree of variability in
seasonality, so you might want to apply an appropriate
transformation using box-cox transformation.
Coming back to the first part of the issue, before using an extrapolation method such as ARIMA or exponential smoothing or fixated on data mining/dredging, I would recommend to find out "why" the trend changed direction and went upwards. Unless you know the "why" part of this trend change, no matter what method you use, it is going to be impossible to improve accuracy or build better forecast. As noted in answer to your earlier question, the only way to build good forecasts for your problem is to systematically adjust the forecast from an extrapolative method using a well structured judgement or use an analogous time series top forecast time series. You could also use an ensemble of judgemental forecasting and extrapolative methods. Using univariate extrapolative method alone on a non-experimental data such as yours bound to produce poor predictions. It is important to do some initial data analysis before fixating on methods and techniques, it might go a long way in improving predictions. Also, using a low frequency data such as rolling the daily data to monthly data and doing data visualization also is very helpful to better understand the data and ultimately better predictions.
Hopefully this analysis provided you some directions for future research.
I have to agree with Whuber, that only way to assess predictive performance of an extrapolation method is using hold out set. Simplest is the single origin forecast,If you have enough resources then I would do rolling forecast testing or cross-validation or jackknifing such as the one suggested by @Irishstat. See the link below for some nice blog post by Rob Hyndman on how to do this for time series data.
http://robjhyndman.com/hyndsight/tscvexample/
http://robjhyndman.com/hyndsight/rolling-forecasts/
I'm also curious to know why you would need a daily forecast for 1 year. In practice based on my own experience, you would use low frequency data (such as monthly/weekly) to do a full year forecast for planning purpose and use high frequency data such a hourly/daily to do a very very short term forecast. When I mean very very short term, update and revise forecast every month. As an example, If I had your data (assuming you want to forecast for 2010), I would predict full year 2010 data using monthly data, and just produce daily forecast for January 2010. By this use you could get the bests of both worlds by have low frequency (less noise) and high frequency (daily data) forecasts. Once you have Jan 2010 data, you could produce daily forecast for February and keep producing and updating the daily forecast. You could repeat this for every month as the new data arrives. In addition you could also reconcile the monthly and daily forecast.


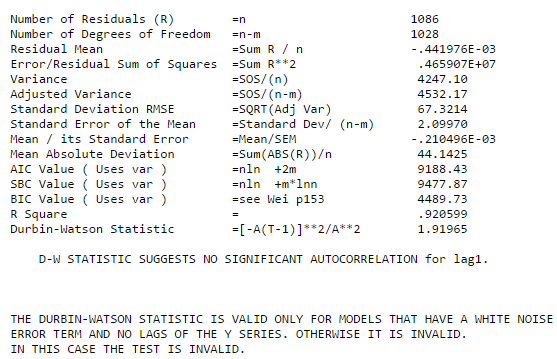
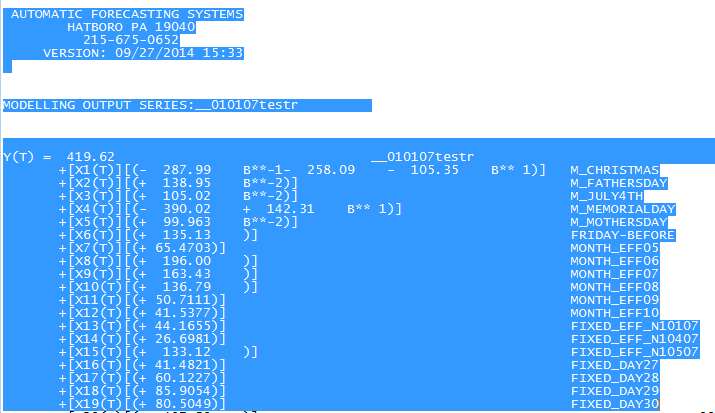 and
and 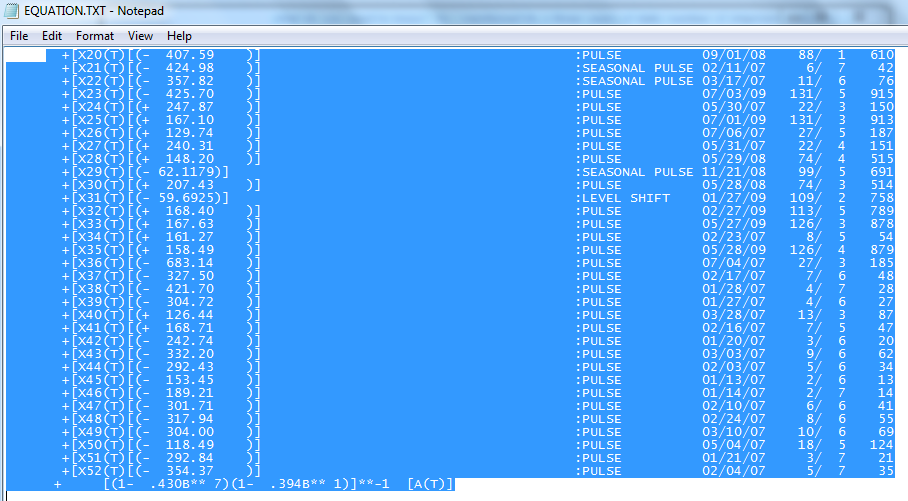 . A test for the sufficiency of a model is the ACF of the errors suggests randomness. Following is the Forecast plot.
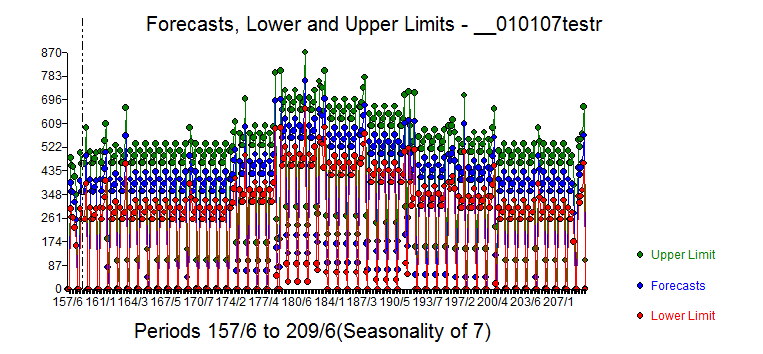 . I have added a representative
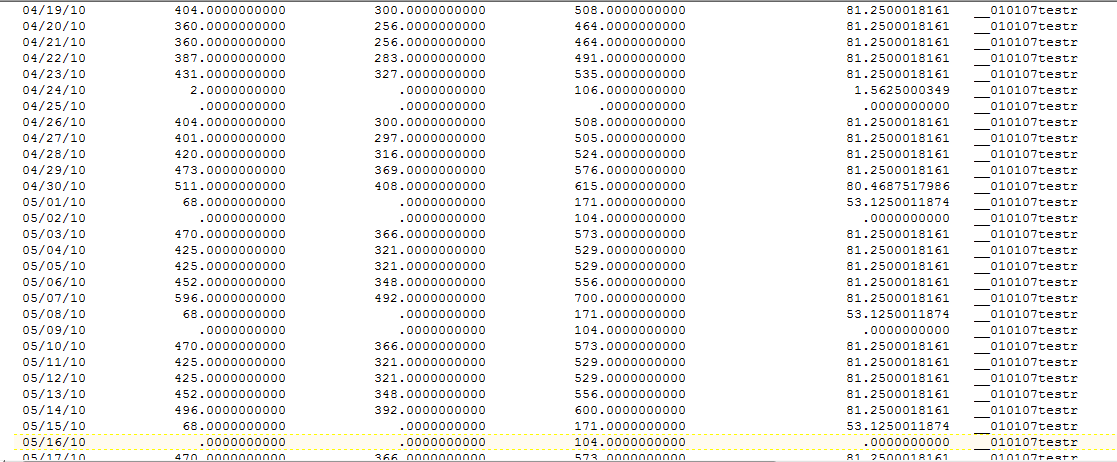 screen shot of the forecasts presented in tabular fashion (forecasts then lower limit then upper limit).