86
$\begingroup$

I am confused about ZCA whitening and normal whitening (which is obtained by dividing principal components by the square roots of PCA eigenvalues). As far as I know,

$$\mathbf x_\mathrm{ZCAwhite} = \mathbf U \mathbf x_\mathrm{PCAwhite},$$ where $\mathbf U$ are PCA eigenvectors.

What are the uses of ZCA whitening? What are the differences between normal whitening and ZCA whitening?

$\endgroup$
1
  • 5
    $\begingroup$ According to "Neural Networks: Tricks of the Trade", PCA and ZCA differ only by a rotation. $\endgroup$ Commented Mar 28, 2017 at 13:18

3 Answers 3

114
$\begingroup$

Let your (centered) data be stored in a $n\times d$ matrix $\mathbf X$ with $d$ features (variables) in columns and $n$ data points in rows. Let the covariance matrix $\mathbf C=\mathbf X^\top \mathbf X/n$ have eigenvectors in columns of $\mathbf E$ and eigenvalues on the diagonal of $\mathbf D$, so that $\mathbf C = \mathbf E \mathbf D \mathbf E^\top$.

Then what you call "normal" PCA whitening transformation is given by $\mathbf W_\mathrm{PCA} = \mathbf D^{-1/2} \mathbf E^\top$, see e.g. my answer in How to whiten the data using principal component analysis?

However, this whitening transformation is not unique. Indeed, whitened data will stay whitened after any rotation, which means that any $\mathbf W = \mathbf R \mathbf W_\mathrm{PCA}$ with orthogonal matrix $\mathbf R$ will also be a whitening transformation. In what is called ZCA whitening, we take $\mathbf E$ (stacked together eigenvectors of the covariance matrix) as this orthogonal matrix, i.e. $$\mathbf W_\mathrm{ZCA} = \mathbf E \mathbf D^{-1/2} \mathbf E^\top = \mathbf C^{-1/2}.$$

One defining property of ZCA transformation (sometimes also called "Mahalanobis transformation") is that it results in whitened data that is as close as possible to the original data (in the least squares sense). In other words, if you want to minimize $\|\mathbf X - \mathbf X \mathbf A^\top\|^2$ subject to $ \mathbf X \mathbf A^\top$ being whitened, then you should take $\mathbf A = \mathbf W_\mathrm{ZCA}$. Here is a 2D illustration:

PCA and ZCA whitening

Left subplot shows the data and its principal axes. Note the dark shading in the upper-right corner of the distribution: it marks its orientation. Rows of $\mathbf W_\mathrm{PCA}$ are shown on the second subplot: these are the vectors the data is projected on. After whitening (below) the distribution looks round, but notice that it also looks rotated --- dark corner is now on the East side, not on the North-East side. Rows of $\mathbf W_\mathrm{ZCA}$ are shown on the third subplot (note that they are not orthogonal!). After whitening (below) the distribution looks round and it's oriented in the same way as originally. Of course, one can get from PCA whitened data to ZCA whitened data by rotating with $\mathbf E$.

The term "ZCA" seems to have been introduced in Bell and Sejnowski 1996 in the context of independent component analysis, and stands for "zero-phase component analysis". See there for more details. Most probably, you came across this term in the context of image processing. It turns out, that when applied to a bunch of natural images (pixels as features, each image as a data point), principal axes look like Fourier components of increasing frequencies, see first column of their Figure 1 below. So they are very "global". On the other hand, rows of ZCA transformation look very "local", see the second column. This is precisely because ZCA tries to transform the data as little as possible, and so each row should better be close to one the original basis functions (which would be images with only one active pixel). And this is possible to achieve, because correlations in natural images are mostly very local (so de-correlation filters can also be local).
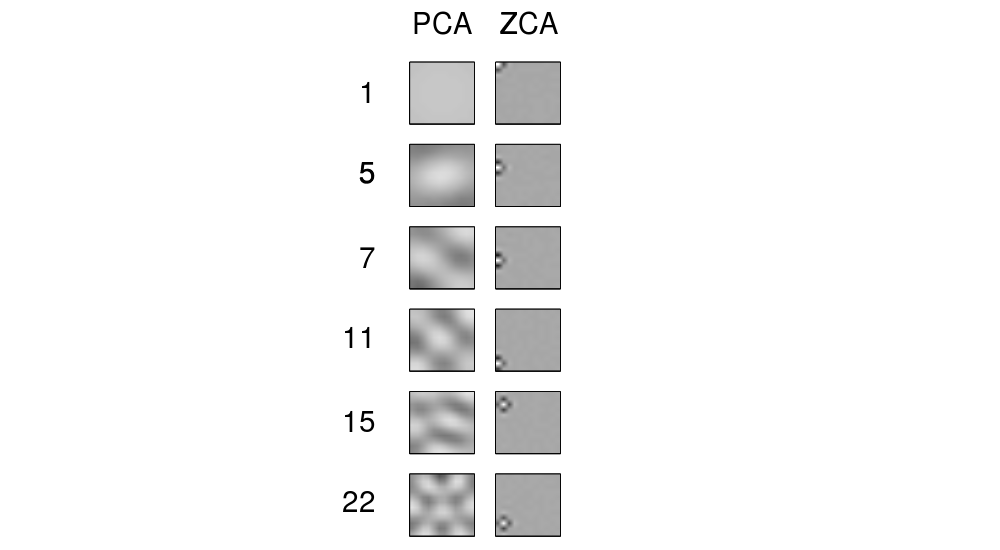
PCA and ZCA in Bell and Sejnowski 1996

Update

More examples of ZCA filters and of images transformed with ZCA are given in Krizhevsky, 2009, Learning Multiple Layers of Features from Tiny Images, see also examples in @bayerj's answer (+1).

I think these examples give an idea as to when ZCA whitening might be preferable to the PCA one. Namely, ZCA-whitened images still resemble normal images, whereas PCA-whitened ones look nothing like normal images. This is probably important for algorithms like convolutional neural networks (as e.g. used in Krizhevsky's paper), which treat neighbouring pixels together and so greatly rely on the local properties of natural images. For most other machine learning algorithms it should be absolutely irrelevant whether the data is whitened with PCA or ZCA.

$\endgroup$
15
  • $\begingroup$ Thanks! I have a question: so is that mean ZCA is basically change the access, but not change much the position of the data? (based on your shading area). Also, is that mean whenever we do whitening, we should do ZCA whitening? How would we decide to use PCAwhitening or ZCA whitening? $\endgroup$ Commented Oct 1, 2014 at 18:12
  • 5
    $\begingroup$ (1) I am not exactly sure what you mean, but I would say it like that: ZCA stretches the dataset to make it spherical, but tries not to rotate it (whereas PCA does rotate it quite a lot). (2) I actually think that in most cases it does not matter if you use PCA or ZCA whitening. The only situation I can imagine where ZCA could be preferable, is pre-processing for convolutional neural networks. Please see an update to my answer. $\endgroup$
    – amoeba
    Commented Oct 1, 2014 at 21:38
  • 7
    $\begingroup$ The PCA is like making a Fourier transform, the ZCA is like transforming, multiplying and transforming back, applying a (zero-phase) linear filter. So what we see there is the filter impulse response at each pixel. The "components" involved in the operation are the same, the columns of E, which are the "principal components"... I mean, you can call the rows of W components too, but I think it is important to understand that the same "principal components" are involved, and when you apply the ZCA you are back at the original domain, while with the PCA you need to "reconstruct" the signal. $\endgroup$ Commented Feb 8, 2017 at 22:20
  • 1
    $\begingroup$ @dividebyzero +1 to your last comment, I think this is a valuable perspective. In any case, I hope the meaning of my last figure (that is taken from the linked paper) is clear now. $\endgroup$
    – amoeba
    Commented Feb 8, 2017 at 22:25
  • 1
    $\begingroup$ @learning You don't see PCA whitened images on that page! They show "PCA dimension-reduced images", i.e. reconstructions via PCA, but not PCA projections themselves. $\endgroup$
    – amoeba
    Commented Oct 7, 2017 at 8:26
27
$\begingroup$

Given an Eigendecomposition of a covariance matrix $$ \bar{X}\bar{X}^T = LDL^T $$ where $D = \text{diag}(\lambda_1, \lambda_2, \dots, \lambda_n)$ is the diagonal matrix of Eigenvalues, ordinary whitening resorts to transforming the data into a space where the covariance matrix is diagonal: $$\sqrt{D^{-1}}L^{-1}\bar{X}\bar{X}^TL^{-T}\sqrt{D^{-1}} = \sqrt{D^{-1}}L^{-1}LDL^TL^{-T}\sqrt{D^{-1}} \\ = \mathbf{I} $$ (with some abuse of notation.) That means we can diagonalize the covariance by transforming the data according to $$ \tilde{X} = \sqrt{D^{-1}}L^{-1}X. $$

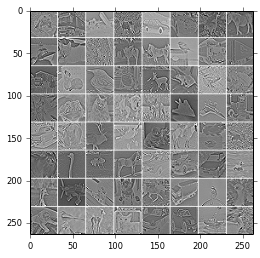
This is ordinary whitening with PCA. Now, ZCA does something different--it adds a small epsilon to the Eigenvalues and transforms the data back. $$ \tilde{X} = L\sqrt{(D + \epsilon)^{-1}}L^{-1}X. $$ Here are some pictures from the CIFAR data set before and after ZCA.

Before ZCA:

before ZCA

After ZCA with $\epsilon = 0.0001$

after ZCA 1e-4

After ZCA with $\epsilon = 0.1$

after ZCA with .1

For vision data, high frequency data will typically reside in the space spanned by the lower Eigenvalues. Hence ZCA is a way to strengthen these, leading to more visible edges etc.

$\endgroup$
9
  • 2
    $\begingroup$ Shouldn't the epsilon be added before taking inverse? I think it's simply added to stabilize the inversion in case of near-zero eigenvalues. So actually if it makes sense to add it for ZCA whitening, then it would make sense to add it for PCA whitening as well. $\endgroup$
    – amoeba
    Commented Oct 1, 2014 at 16:19
  • $\begingroup$ Yes, before the inverse, thanks. Since this is typically done with SVD in practice, I don't know whether stabilizing the inversion is necessary at all. $\endgroup$
    – bayerj
    Commented Oct 1, 2014 at 18:27
  • $\begingroup$ I have added another picture to show the effect. $\endgroup$
    – bayerj
    Commented Oct 1, 2014 at 18:35
  • 2
    $\begingroup$ +1, but I have a number of further nitpicks and questions. (1) What I meant about epsilon is that it is not specific to ZCA, it can be used for PCA whitening as well. (2) I am not sure I understand your comment about SVD: SVD or not, one needs to invert singular values, hence the need for epsilon. (3) PCA whitening transformation is $D^{-1/2}L^\top$, you wrote it the other way round, and this makes the computation in the second formula wrong... (4) Nice figures, where are they from? (5) Do you know in which situations would ZCA whitening be preferable to PCA whitening, and why? $\endgroup$
    – amoeba
    Commented Oct 1, 2014 at 19:31
  • $\begingroup$ (1) agreed. I have no intuition about what that means, though. (2) My decomposition knowledge is incomplete here, but I assumed that a classical inversion matrix on a singular covariance matrix will fail, while SVD on a data matrix giving rise to a singular covariance will not. (3) Thanks, will fix it. (4) From my code :) (5) I hypothesize that for many algorithms that give overcomplete representations (e.g. GainShape K-Means, Auto encoders, RICA) and/or do a similar job like PCA algebraic indepence of the features hurts, but I have no hard knowledge about this. $\endgroup$
    – bayerj
    Commented Oct 1, 2014 at 19:56
2
$\begingroup$

I'll add the following plot to illustrate visually the difference between PCA-whitening and ZCA-whitening : the only thing you need to understand is what a rotation matrix is (aka orthonormal matrix), and that PCA-whitening and ZCA-whitening are just one rotation appart.

  1. First plot is the raw data, along 2 arrows on X and Y axis, and a circle to better understand the transformations.
  2. Second plot is PCA-whitened data, and the same transformation is applied to the arrows and circle points
  3. Third plot is ZCA-whitened data

enter image description here

You can then notice that :

  • Covariance matrix is identity matrix in both PCA and ZCA cases
  • PCA-whitened and ZCA-whitened data are indeed a rotation appart (rotate the second plot about 60° countclock-wise and you get the third plot)
  • ZCA-whitened data has an orientation similar to that of the original data (that is red is basicaly on lower left side, and blue on upper right side). We say that ZCA-whitened data "ressembles" the most the original data. On the hand, PCA could have had any orientation.

Also, I found Optimal whitening and decorrelation, Agnan Kessy, Alex Lewin, Korbinian Strimmer (arXiv:1512.00809) to be a great ressource on whitening.

Disclaimer : plot image above taken from PCA-whitening vs ZCA-whitening : a numpy 2d visual

$\endgroup$

Your Answer

By clicking “Post Your Answer”, you agree to our terms of service and acknowledge you have read our privacy policy.

Not the answer you're looking for? Browse other questions tagged or ask your own question.