I'm going to assume you meant for us to assume exponentially-distributed inter-arrival time distributions. Otherwise you will need to provide us with more information.
Under that assumption, both arrival distributions are:
$$T_{\text{arrival}} \sim \text{Exponential} \left( \frac{1}{5} \right)$$
And it appears that you are telling us that the service time distributions are the same for both classes of item:
$$T_{\text{service}} \sim \text{Exponential} \left( \frac{1}{5} \right)$$
The queueing delay is the time a job waits in a queue until an item can be served. This is also called the waiting time, and it sounds like you are interested in the expected wait time conditioned on whether the item was in one of these two groups. You have not told us how many servers there are, so the problem cannot be uniquely answered. Let us suppose that there is one server for the sake of example, and you can change the code below to obtain different answers if you had some other number in mind.
We can readily simulate this using Ciw. Let's simulate for $10^4$ items.
# Import required libraries
import ciw
import pandas as pd

# Set a seed to fix the pseudorandom result
ciw.seed(2018)

# Instantiate a network object accord to specification
network = ciw.create_network(
    arrival_distributions = [ciw.dists.Exponential(1/5)],
    service_distributions = [ciw.dists.Exponential(1/5)],
    number_of_servers = [1]
    )

# Instantiate a simulation object which will run the simulation
simulation = ciw.Simulation(network)

# Simulate until 10^4 customers have sojourned
simulation.simulate_until_max_customers(10000)

# Collect and process simulation results
records = pd.DataFrame(simulation.get_all_records())
records['group'] = (records.service_start_date - records.arrival_date) < 5
records['group'] = records['group'].apply(lambda x: 'lower' if x else 'upper')

# Print summary of results as Markdown table
print(
    (records
     .groupby('group')['waiting_time']
     .describe()
     .to_markdown())
    )
| group |
count |
mean |
std |
min |
25% |
50% |
75% |
max |
| lower |
252 |
1.26813 |
1.64162 |
0 |
0 |
0.0176671 |
2.49742 |
4.9942 |
| upper |
9748 |
241.778 |
159.389 |
5.0305 |
100.27 |
225.795 |
349.237 |
622.003 |
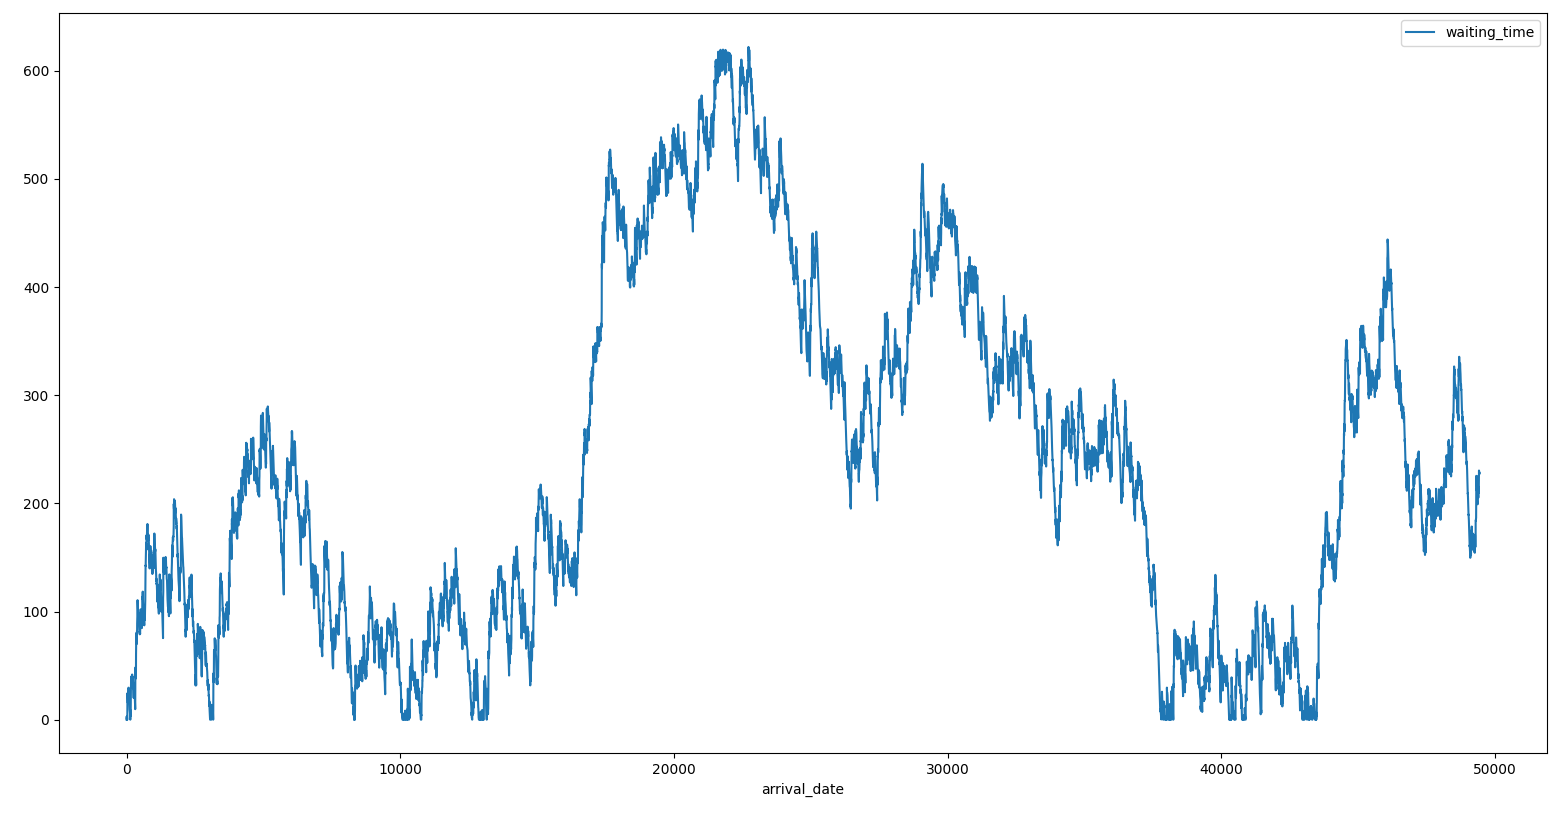
You can see that the average for those in the lower group is about 1.26813. However, I would not trust the mean for the upper group to be 241.778. Why? Because I don't think it is stationary. Take a peek at the plot of the arrival date vs waiting time.
records.plot(x='arrival_date', y='waiting_time'); plt.show()

Because $\rho = \frac{\lambda}{\mu} = 1 \not < 1$, the system is unstable. These statistics (especially for the upper group) will depend on how long you simulate for.

