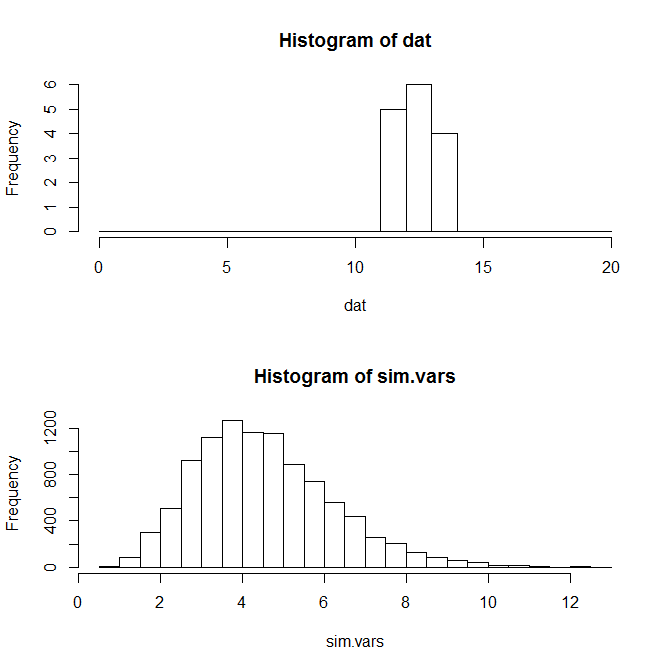
Say someone who is well practiced (appears to have reached a performance plateau) shoots 20 free throws on 15 different days and is successful the number of times shown in the upper histogram (dat in the code).
My understanding is that the distribution of outcomes should be predicted by the binomial distribution. Is this correct?
The expected variance is $np(1-p)$, where $n = 20$ (the number of trials per session) and $p = {\rm mean}/n =.65$ or the average percent of successes.
I could not figure out how to theoretically calculate the distribution of sample variances, so ran a Monte Carlo simulation. These results are shown in the lower panel. the mean of these variances matches with the theoretical expected variance, but the variance of the data is much less.
R code:
dat  <- c(12,12,13,12,13,12,12,14,13,13,14,13,14,13,14)
n    <- 20
p    <- mean(dat)/n
Nobs <- length(dat)

sim.vars = matrix(nrow=10000)
for(s in 1:10000){
  sim.vars[s] <- var(rbinom(Nobs, n, p))
}
par(mfrow=c(2,1))
hist(dat,      breaks=seq(0,20,by=1))
hist(sim.vars, breaks=20)


> var(dat)       # Variance of Data
[1] 0.6380952
> n*p*(1-p)      # Expected Variance given binomial model
[1] 4.569778
> mean(sim.vars) # Mean of simulated sample variances
[1] 4.542159

@Whuber, I hit enter when the cursor was outside the text box and it submitted before completing the question. I apologize. The first thing I wanted to know if I have made some error anywhere in my thinking (choice of binomial model, simulation, calculation), which your comment suggests I have not.
The second is what processes could possibly generate such data? I have >30 like this from multiple sources, so it is probably not data entry error or made up data. The actual task is not shooting free throws but you can take my word that it really is an equivalent situation.
This peculiarity of the data has not been noted previously. Others have interpreted such data as representing the max performance level achieved, and compared group averages under different conditions. Difference between individuals have been interpreted as differences in skill level, somehow related to neurological characteristics. As far as I can tell, this interpretation (as plateau/ asymptote/ max performance) implies sampling from a binomial distribution, which is really inconsistent with the underdispersion.
An analogous situation would be someone flipping a coin 20 times and always getting 9/10/11 heads. This is too consistent. The only mechanism I have thought of is introducing negative correlation between consecutive trials. Something like:
if(dat[t-1]=success){ p=0 }else{ p=0.95 } # Arbitrary probs used for example
dat[t]=sample(c(miss,success),1,prob=c(1-p,p))
What other processes could result in this underdispersion? The literature on underdispersion appears to be very sparse. I found it consists mostly of simply finding distributions that can fit such data that lack any clear physical interpretation. That type of analysis is not of interest to me here. Perhaps I missed something due to using inappropriate terminology?
Edit2: @whuber In response to your second comment: It really is just like the free throws, almost any explanation that works for that will also apply. An exception is that a person may purposefully miss on the free throw task to maintain a certain score, while that is implausible here.
The task requires motor coordination to attain a goal. A success requires performing a sequence of movements in the correct order, each in the correct fashion (of course with some level of variation). There may also be multiple strategies that can yield success with different/same probability (ie underhand vs overhand shots). It is possible these are used in different trials by the same subject. Unfortunately, the only data available is number of successes per session (20 trials).
I do not think I am looking for "ways to construct probability models of underdispersed phenomena", at least not in general. I am not interested in only describing the data, rather for a process that can result in this type of data. The goal is to elucidate what may actually be being measured here if not max/asymptotic/plateau performance level.
To clarify what I mean by "process", I am thinking that a monte carlo simulation can be created using some combination of if/then statements and (possibly multiple per trial) samples of correct/incorrect actions, states, and/or events that occur with various probabilities. However, there may be other ways of modeling this.
Edit3: @gung I do not think we will be able to identify a process/mechanism from this data alone, but we can hypothesize a few consistent with the data. These will then make predictions regarding other/more detailed measurements (eg trial-to-trial scores) before running the study. This is useful because it suggests what it is important to look for and record when performing the experiments.
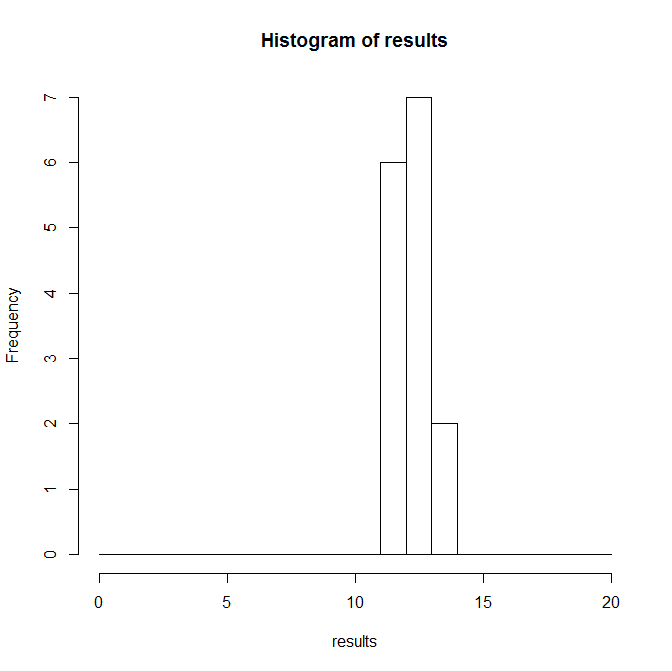
I thought of another possible mechanism. The model below simulates a situation where the subject is "satisfied" after a threshold # of successes (here thresh=12). The output shown had variance=0.495. If this model were accurate, rather than performance, these experiments appear to measure some kind of motivation threshold. This would be completely different than measuring a skill level, and really alter how these results are interpreted. However, this model predicts many more successes at the beginning of the session than the end. While I do not have actual data recorded regarding this, the prediction is inconsistent with my memory/impression of what unfolded. If anything, I suspect the opposite would be true.
I am looking for further ideas on what the explanation may be as I could not find any hints in the literature.
p.motivated=.9; p.unmotivated=.1; n=20; thresh=12; sessions=15
results<-matrix(nrow=sessions)
for(s in 1:sessions){
  session.dat<-matrix(nrow=n,0)
  for(t in 1:n){
    if(sum(session.dat)<thresh){
      session.dat[t]<-sample(c(0,1),1,prob=c(1-p.motivated,p.motivated))
    }else{
      session.dat[t]<-sample(c(0,1),1,prob=c(1-p.unmotivated,p.unmotivated))
    }
  }
  results[s]<-sum(session.dat)
}

hist(results,breaks=seq(0,20,by=1))
var(results)

