You've been using the default values of mean, sd and xi.
library(fGarch)
median(rsnorm(n=100e3,mean=0,sd=1,xi=1.5)) # Median of random sample
qsnorm(p=0.5,mean=0,sd=1,xi=1.5) # Median from quantile function
Gave your output:
> median(rsnorm(n=100e3,mean=0,sd=1,xi=1.5))  # Median of random sample
[1] -0.1159801
> qsnorm(p=0.5,mean=0,sd=1,xi=1.5)  # Median from quantile function
[1] -0.5941504
Let's check the cumulative distribution functions:
psnorm(-0.1159801,mean=0,sd=1,xi=1.5) # Median of random sample, comes out close enough
[1] 0.5006487

psnorm(-0.5941504,mean=0,sd=1,xi=1.5) # From the quantile function, expect 0.5 exactly
[1] 0.3076923
Well that's odd. Is something up with the quantile function? This is even odder:
qsnorm(p = seq(from = 0.45, to = 0.55, by = 0.01), mean=0, sd=1, xi=1.5)
 [1] -0.22682722 -0.19701387 -0.16617075 -0.13413508 -0.10071017 -0.59415042
 [7] -0.09171829 -0.06558985 -0.03925899 -0.01271222  0.01406462
So qsnorm(p = 0.5) does not seem consistent with nearby quantiles. What if we change mean, sd and xi from their default values?
qsnorm(p = seq(from = 0.45, to = 0.55, by = 0.01), mean=2, sd=0.5, xi=1.2)
 [1] 1.907266 1.919828 1.932450 1.945145 1.957927 1.857169
 [7] 1.982745 1.995506 2.008334 2.021235 2.034215
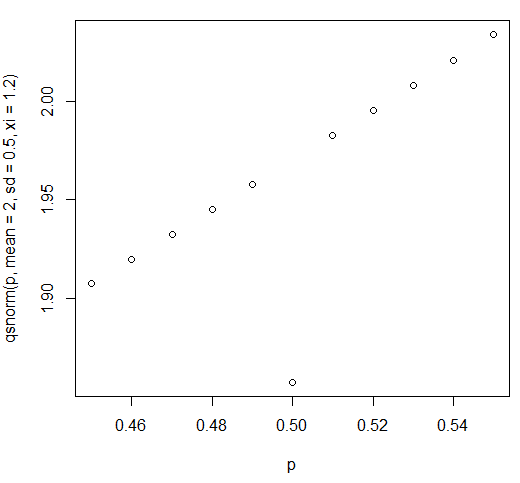
Less conspicuous this time, but the ouput of qsnorm(p = 0.5, mean=2, sd=0.5, xi=1.2) is 1.857169 and once again is inconsistent with nearby quantiles.
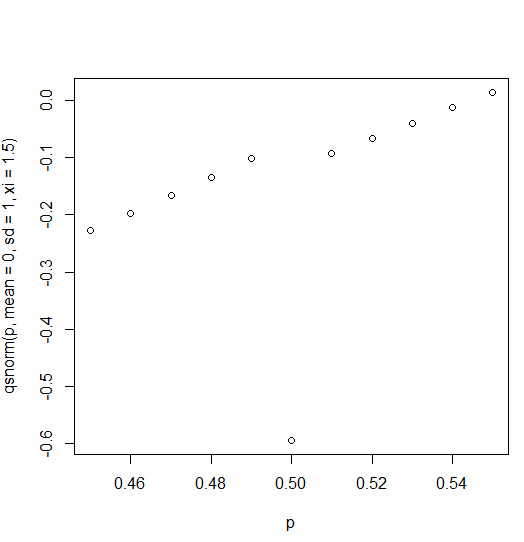
EDIT: but both "medians" are conspicuous on a plot.
p <- seq(from = 0.45, to = 0.55, by = 0.01)
plot(p, qsnorm(p, mean = 0, sd = 1, xi = 1.5)) # default parameters

plot(p, qsnorm(p, mean = 2, sd = 0.5, xi = 1.2)) # alternative parameters

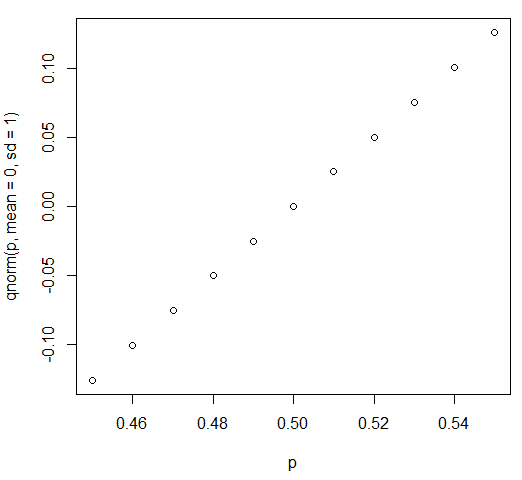
This looks to me like an issue with qsnorm and I can't see anything in the documentation for it. For comparison, qnorm does exactly what you might expect for the normal distribution.
qnorm(p = seq(from = 0.45, to = 0.55, by = 0.01), mean=0, sd=1)
 [1] -0.12566135 -0.10043372 -0.07526986 -0.05015358 -0.02506891
 [6]  0.00000000  0.02506891  0.05015358  0.07526986  0.10043372
[11]  0.12566135

plot(p, qnorm(p, mean = 0, sd = 1))

EDIT: just in case this changes in future versions I ought to include:
> packageVersion("fGarch")
[1] ‘3010.82’


rsnandqsnfrom thesnpackage. $\endgroup$snpackage don't have this problem. I also experimented with using theskewtpackage, and setting the degrees of freedom parameter to the skewed T distribution very high (to approximate a normal) ... this also worked, after allowing for the differing parameterisation inskewt. I will submit a bug report to the maintainer of thefGarchpackage. $\endgroup$