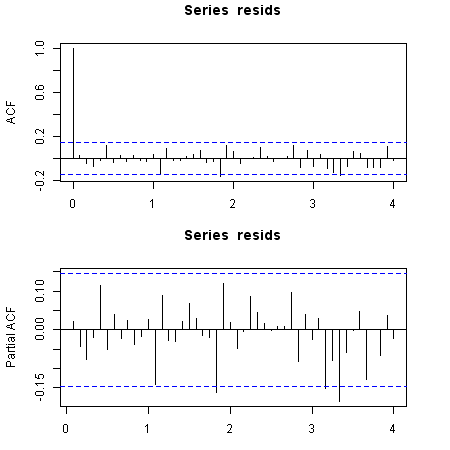
My problem is similar to this one from stack overflow: https://stackoverflow.com/questions/23568275/cannot-remove-time-series-seasonality
I'll provide some data and make it more detailed. Please keep in mind that I am a beginner in time series, so do not overcomplicate my problem.
[1] 7.857481 8.122074 8.074026 8.042699 8.231110 8.346642 8.561210 8.395252
[9] 8.276903 8.246958 8.205492 8.241440 7.734121 7.984122 8.001355 8.201386
[17] 8.342364 8.504108 8.633731 8.604105 8.195334 7.971776 8.243283 7.770223
[25] 7.770223 7.828436 8.032360 8.223627 8.331105 8.372399 8.527935 8.544419
[33] 8.104703 8.162801 8.240121 8.144969 7.662468 7.833204 8.012018 8.091015
[41] 8.248529 8.300777 8.393895 8.566935 8.296297 8.030735 8.150468 8.220941
[49] 7.577634 7.864804 8.195885 7.950150 8.304495 8.184235 8.348775 8.416931
[57] 7.969704 7.964156 8.137396 8.058011 7.650169 7.687539 7.909857 7.990915
[65] 8.316789 8.151910 8.291547 8.352083 7.956827 7.971431 8.141190 8.103797
[73] 7.556951 7.702556 7.749322 7.906179 8.197814 8.100161 8.384119 8.398860
[81] 7.928046 7.951559 7.947325 8.231642 7.383989 7.584773 7.717796 8.090096
[89] 8.059592 7.996990 8.304247 8.132119 7.971776 7.845808 8.024862 8.220672
[97] 7.470224 7.693026 7.695303 7.929126 8.031385 8.128290 8.350194 8.044947
[105] 7.833600 7.731931 7.959276 8.161090 7.351158 7.570443 7.707962 7.892078
[113] 8.053569 8.078378 8.322880 8.144969 7.816820 7.761745 8.001690 8.059276
[121] 7.409136 7.452982 7.871693 7.747597 7.998335 8.090402 8.281724 7.978311
[129] 7.774856 7.807103 7.966587 7.855157 7.192934 7.430114 7.806696 7.829630
[137] 7.949444 7.921898 8.138857 8.008366 7.770223 7.609367 7.826842 8.060856
[145] 7.342779 7.404279 7.655391 7.789455 7.959276 7.945201 8.089482 7.865572
[153] 7.724888 7.718685 7.841886 7.957177 7.096721 7.252762 7.582738 7.609862
[161] 7.753194 7.886081 7.980366 7.873217 7.664816 7.479864 7.834392 7.921173
[169] 7.050989 7.357556 7.583248 7.885705 7.763871 7.860185 7.906179 7.738052
[177] 7.789869 7.608871 7.937017 7.810758
"","x"
"1",7.85748078694253
"2",8.12207437536222
"3",8.07402621612406
"4",8.04269949689764
"5",8.23110984032815
"6",8.3466420902212
"7",8.56121007683301
"8",8.39525152061099
"9",8.27690348126706
"10",8.24695803256818
"11",8.20549161312024
"12",8.24143968982973
"13",7.7341213033283
"14",7.98412195870293
"15",8.0013550258267
"16",8.20138595523861
"17",8.34236350038058
"18",8.50410795186758
"19",8.63373100766419
"20",8.60410456340553
"21",8.19533366716287
"22",7.97177612288063
"23",8.24328252304838
"24",7.77022320415879
"25",7.77022320415879
"26",7.82843635915759
"27",8.0323601479245
"28",8.22362717580548
"29",8.33110454805304
"30",8.372398606513
"31",8.52793528794814
"32",8.54441917766983
"33",8.10470346837111
"34",8.16280135349207
"35",8.24012129807647
"36",8.14496941708788
"37",7.66246781520024
"38",7.83320394864106
"39",8.01201823915906
"40",8.09101504171053
"41",8.24852912480022
"42",8.30077696085145
"43",8.39389497507174
"44",8.56693528331105
"45",8.29629711264251
"46",8.03073492409854
"47",8.150467911624
"48",8.22094116828139
"49",7.57763383260273
"50",7.86480400332846
"51",8.1958853913148
"52",7.95014988765202
"53",8.30449489796357
"54",8.18423477409482
"55",8.34877453979127
"56",8.41693076947784
"57",7.96970358327866
"58",7.96415571884094
"59",8.13739583005665
"60",8.05801080080209
"61",7.650168700845
"62",7.68753876620163
"63",7.9098566672694
"64",7.99091546309133
"65",8.31678912707152
"66",8.15190987294091
"67",8.29154650988391
"68",8.35208267135264
"69",7.95682712209011
"70",7.97143099776935
"71",8.14118979345769
"72",8.10379671298179
"73",7.5569505720129
"74",7.70255611326858
"75",7.74932246466036
"76",7.90617884039481
"77",8.1978140322212
"78",8.10016144693661
"79",8.3841188371909
"80",8.39886000445437
"81",7.92804560087478
"82",7.95155933115525
"83",7.94732502701646
"84",8.23164217997341
"85",7.38398945797851
"86",7.5847730776122
"87",7.71779621101358
"88",8.09009578318096
"89",8.05959232888755
"90",7.99699040583765
"91",8.30424746507847
"92",8.13211877295581
"93",7.97177612288063
"94",7.8458075026378
"95",8.02486215028641
"96",8.22067217029725
"97",7.47022413589997
"98",7.69302574841789
"99",7.69530313496357
"100",7.9291264873068
"101",8.03138533062553
"102",8.12829017160705
"103",8.35019365072007
"104",8.04494704961772
"105",7.8336002236611
"106",7.73193072194849
"107",7.9592759601164
"108",8.1610895128458
"109",7.35115822643069
"110",7.57044325205737
"111",7.70796153183549
"112",7.89207842124812
"113",8.05356916913454
"114",8.07837810362652
"115",8.3228800217699
"116",8.14496941708788
"117",7.81681996576455
"118",7.76174498465891
"119",8.00168997809913
"120",8.05927622330565
"121",7.40913644392013
"122",7.45298232946546
"123",7.87169266432365
"124",7.74759683869289
"125",7.99833539595298
"126",8.09040229659332
"127",8.28172399041139
"128",7.97831096986772
"129",7.77485576666552
"130",7.80710329012598
"131",7.9665866976384
"132",7.85515700588134
"133",7.1929342212158
"134",7.4301141385618
"135",7.80669637252118
"136",7.82963038915019
"137",7.94944442025063
"138",7.9218984110238
"139",8.13885675069633
"140",8.00836557031292
"141",7.77022320415879
"142",7.60936653795421
"143",7.82684209815829
"144",8.06085575293432
"145",7.34277918933185
"146",7.40427911803727
"147",7.65539064482615
"148",7.78945456608667
"149",7.9592759601164
"150",7.94520113241276
"151",8.08948247436075
"152",7.86557175768479
"153",7.72488843932307
"154",7.71868549519847
"155",7.84188592898462
"156",7.95717732345947
"157",7.09672137849476
"158",7.25276241805319
"159",7.58273848891441
"160",7.60986220091355
"161",7.75319426988434
"162",7.88608140177575
"163",7.98036576511125
"164",7.87321705486274
"165",7.66481578528574
"166",7.47986413116503
"167",7.83439230291044
"168",7.92117272158701
"169",7.05098944706805
"170",7.35755620091035
"171",7.58324752430336
"172",7.88570539124302
"173",7.76387128782022
"174",7.86018505747217
"175",7.90617884039481
"176",7.73805229768932
"177",7.78986855905471
"178",7.60887062919126
"179",7.93701748951545
"180",7.81075811652936
I uploaded two types of the data. They are exactly the same. One is copy from R directly, and the latter is export.csv from R.
First, I plot acf for data and get this:
Well, I cannot post images. But you can get the image by a simple acf command in R.
Then, I difference lag 12 by datadif <- data[13:180] - data[1:168], and the new act plot is:
From the second figure, you can see that lag 12 is still significant. Even I try diff for datadif, I fail to remove seasonality.
What is this phenomenon? Briefly, how can we deal with it? I did not find the answer in the textbook.
Thanks in advance.

