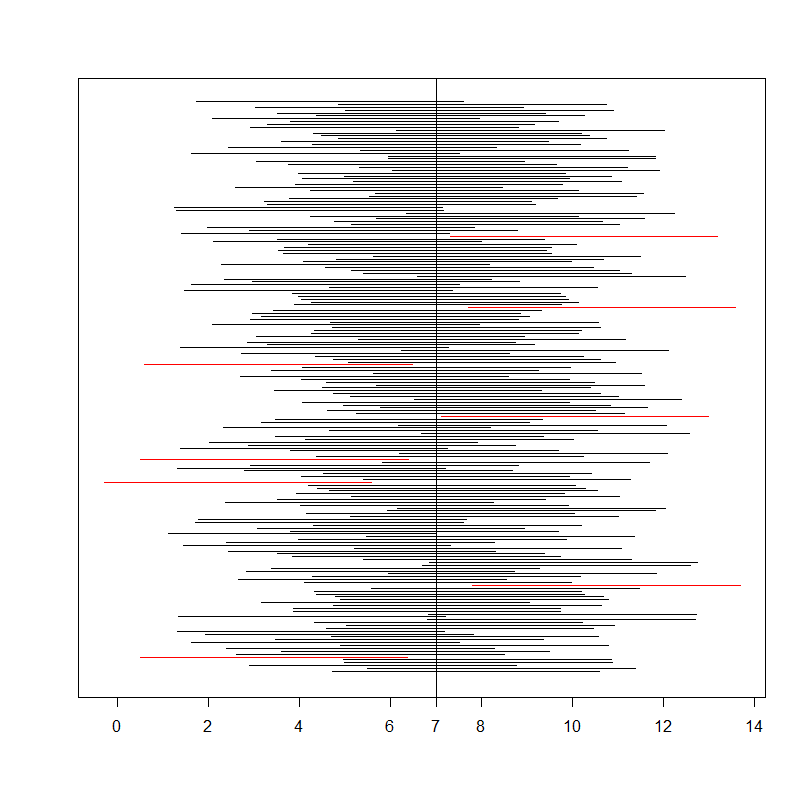
The confidence interval you list is correct. Plugging your numbers in, I get a 95% confidence interval of $(4.06;\,9.94)$. Concerning the interpretation, a quick search on the site revealed many interesting posts. The Wikipedia page also has a section on the interpretation of confidence intervals.
In short, there is not 95% probability that the above interval contains $\mu$ (the true mean). Rather, if you would calculate 100 95% confidence intervals in this way, 95% of them are expected to include $\mu$. But after you calculated your confidence interval, $\mu$ is either included or not.
Here is a small simulation in R to illustrate the procedure:
set.seed(123)
pop <- rnorm(1e7, mean = 7, sd = 3)

CI <- function(x, alpha = 0.05, true.sd) {
  res <- c(mean(x) - qnorm(1-alpha/2)*(true.sd/sqrt(length(x)))
           , mean(x) + qnorm(1-alpha/2)*(true.sd/sqrt(length(x))))
  res

}

n.sim <- 200
n <- 4

cis <- replicate(n.sim, CI(x = sample(pop, size = n, replace = TRUE), alpha = 0.05, true.sd = 3))

does.not.cover <- (cis[1, ] > 7) | (cis[2, ] < 7)

sum(does.not.cover)/n.sim

[1] 0.04

a <- min(cis[1, ])
b <- max(cis[2, ])
plot(0, 0, type = 'n', xlim = c(a, b), ylim = c(0, n.sim), ann = FALSE, yaxt = "n")
axis(1, at = 7, label = 7)
segments(cis[1, ], 1:n.sim, cis[2, ], 1:n.sim,
         col = ifelse(does.not.cover, 'red', 'black'))
abline(v = 7)

I simulated 200 95% confidence intervals based on samples of $n=4$ from a population with mean $7$ and standard deviation $3$ (assumed to be known). 4% (i.e. 8) of the 200 95% confidence intervals don't contain the true mean of 7 (red segments in the picture). In the long run, the proportion of confidence intervals that don't contain the true mean is $\alpha$ (5% in this case).

