3
$\begingroup$

I have some physical experiments done at various locations. The locations produces a set of observations y for one value of x, the independent variable. In the end across a set of locations I have values in the following form

[y11, y21, y31, y41, y51, y61...] for one value of x, say x1

Then I repeat the experiment and get a new set of values

[y21, y22, y32, y42, y52, y62...] for a different value of x say x2

Ans so on.

In the end I have readings for y for 5 distinct values of x, [x1, x2, x3, x4, x5]

I wish to fit a quadratic to this data, and my main goal is to find the value of x, for which y is maximum. One way to do this is to define an average y for each x1 and fit a quadratic with the averaged out values. I know that fitting a quadratic to just 5 points is not a good idea. I am open to other ideas, that can help me solve the problem without directly fitting a functional relationship.

Some non-parametric idea for instance. One idea I have is to do some distribution analysis on values of y for x1, vs values of y for x2 and so on. This enables me to take all the y values for one x1, without averaging them. I would be open to other ideas and suggestions.

$\endgroup$
4
  • $\begingroup$ "without directly fitting a functional relationship" - why don't you want to fit this? (I assume you have good reasons for suspecting a quadratic relationship, right?) $\endgroup$ Commented Jan 12, 2015 at 15:23
  • $\begingroup$ Yes, I do. Well, primarily because I think 5 points is too little to infer the curvature and the slope etc. I guess what I mean to say is to find out a way to "not loose" the information by virtue of averaging the values of y, while fitting the quadratic. $\endgroup$
    – gbh.
    Commented Jan 12, 2015 at 15:26
  • $\begingroup$ What causes variation in the measurment x within each location? Is it measurment error or somethong else? $\endgroup$ Commented Jan 12, 2015 at 15:36
  • $\begingroup$ Locational effects primarily plus yes some measurement error. $\endgroup$
    – gbh.
    Commented Jan 12, 2015 at 15:37

1 Answer 1

3
$\begingroup$

You are right that inferring a parabola from five points is too little data. But you have more than five points, namely all your measurements! Don't do any averaging (though this would already help), just fit the parabola to all your data. Model fitting doesn't mind multiple x values.

Let's do this in R. Some dummy data over five different x values:

set.seed(1)
xx <- rep(1:5,each=10)
yy <- -xx^2+6*xx-5+rnorm(length(xx),0,1)

Now we can fit the model. Note the I() to protect your square term, and note that this really presupposes homoskedastic errors:

model <- lm(yy~xx+I(xx^2))

Now we have a quadratic relationship. Some elementary calculus gives us the (estimated) x coordinate of maximum of the fitted parabola:

xx.max <- -coef(model)[2]/(2*coef(model)[3])

It's always a good idea to get an idea about the variability of our results. It may be possibly to derive a confidence interval for xx.max analytically, but the bootstrap is always easier, and given enough data (50 points should be enough), it should be valid:

require(boot)
foo <- boot(data=data.frame(xx=xx,yy=yy),statistic=function(data,indices){
        model <- lm(yy~xx+I(xx^2),data[indices,])
        -coef(model)[2]/(2*coef(model)[3])},
    strata=xx,
    R=1000)

Note that I am doing a stratified bootstrap, i.e., I am sampling with replacement within each x value, which makes sense here, since the data really are stratified.

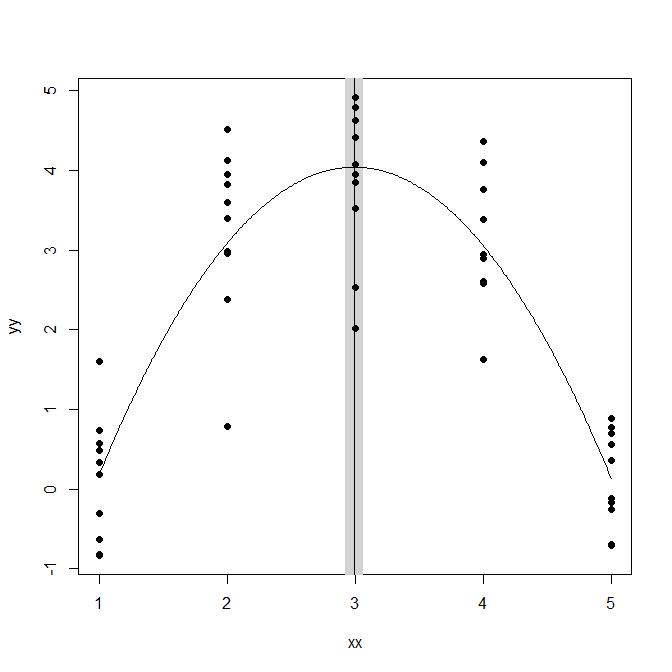
So we can plot our points, the fitted parabola and the x coordinate of the estimated maximum together with the bootstrapped confidence interval:

plot(xx,yy,pch=19)
rect(quantile(foo$t,0.025),-2,quantile(foo$t,0.975),6,border=NA,col="lightgrey")
points(xx,yy,pch=19)
xx.plot <- seq(1,5,by=.01)
lines(xx.plot,predict(model,newdata=data.frame(xx=xx.plot)))
abline(v=xx.max)

parabola

$\endgroup$
9
  • $\begingroup$ This is interesting, never thought like this though I know this can be done. What advantages (statistical) does this have over just averaging the data? $\endgroup$
    – gbh.
    Commented Jan 12, 2015 at 15:36
  • 3
    $\begingroup$ Truth be told, averaging probably gives you pretty similar results. One difference is that here, every point has the same impact on the result - if you average first and the groups have different sizes, then a point in a small group will have a larger impact on the end result than a point in a big group. $\endgroup$ Commented Jan 12, 2015 at 15:39
  • 1
    $\begingroup$ I edited the answer to add a bootstrapped confidence interval. This works fine for my toy data but may blow up if your estimated leading coefficient is close to zero. But try it! No estimate should come without a measure of its variability! $\endgroup$ Commented Jan 12, 2015 at 15:51
  • $\begingroup$ Thanks Stephan, how about this. For the bootstrap, I randomly sample one y for each of x1, x2, x3, x4, x5, i.e from the respective distributions. So in the end I have tuples of points (xi,yi), where i is 1 to 5. Note y1, is a random sample from the distribution [y11, y12, y13, ....]. I do this howsoever times I want, fit the quadratic, find the maxima. And then use this to find the confidence. $\endgroup$
    – gbh.
    Commented Jan 12, 2015 at 15:55
  • $\begingroup$ That is also a possibility. It will essentially simulate having only one y per x, though, "forgetting" that you really have many more data points. It will thus overestimate the variance for the max estimate. Alternatively, do a stratified bootstrap, sampling with replacement within each x coordinate. That would probably be more appropriate for your data, anyway. Let me edit the question to stratify. (Not that it makes a big difference, anyways.) $\endgroup$ Commented Jan 12, 2015 at 16:02

Your Answer

By clicking “Post Your Answer”, you agree to our terms of service and acknowledge you have read our privacy policy.

Not the answer you're looking for? Browse other questions tagged or ask your own question.