445
$\begingroup$

K-means is a widely used method in cluster analysis. In my understanding, this method does NOT require ANY assumptions, i.e., give me a dataset and a pre-specified number of clusters, k, and I just apply this algorithm which minimizes the sum of squared errors (SSE), the within cluster squared error.

So k-means is essentially an optimization problem.

I read some material about the drawbacks of k-means. Most of them say that:

  • k-means assumes the variance of the distribution of each attribute (variable) is spherical;
  • all variables have the same variance;
  • the prior probability for all k clusters is the same, i.e., each cluster has roughly equal number of observations;

If any one of these 3 assumptions are violated, then k-means will fail.

I could not understand the logic behind this statement. I think the k-means method makes essentially no assumptions, it just minimizes the SSE, so I cannot see the link between minimizing the SSE and those 3 "assumptions".

$\endgroup$
8
  • 58
    $\begingroup$ I would say that the number of clusters is already quite an assumption. $\endgroup$
    – njzk2
    Commented Jan 16, 2015 at 16:58
  • 35
    $\begingroup$ The key assumptions of k-means are: 1. there are k clusters. 2. SSE is the right objective to minimize. 3. all clusters have the same SSE. 4. all variables have the same importance for every clusters. These are pretty strong assumptions... $\endgroup$ Commented Jan 17, 2015 at 14:12
  • 2
    $\begingroup$ To your second question (posted as answer, then deleted): if you want to understand k-means as optimization problem similar to linear regression, understand it as quantization. It tries to find the least squares approximation of the data using $k$ instances. I.e. if you actually replaced every point by the nearest centroid. $\endgroup$ Commented Jan 19, 2015 at 9:48
  • 2
    $\begingroup$ @Anony-Mousse, I read some material and later on come up with the following thought: $k-$means as a statistical model (rather than optimization method) assumes that there are k clusters underlying and the dispersion of the data are purely due to normal random noise with equal variance. This is analogous to the assumption of simple linear regression model. Then (I believe, I haven't found a paper) by some version of Gauss-Markov theorem, $k-$means will give you consistent estimator of the mean of the underlying k clusters we assumed for our data. $\endgroup$
    – KevinKim
    Commented Jan 19, 2015 at 20:34
  • 1
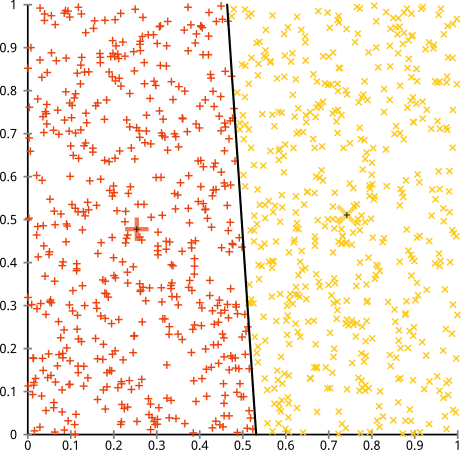
    $\begingroup$ I added an illustration to my answer below of a data set where one might assume k-means works really well (all clusters of same shape) yet it still gets stuck in local minima; and even 1000 iterations did not find the optimum result. $\endgroup$ Commented Jan 19, 2015 at 21:58

5 Answers 5

361
+50
$\begingroup$

While I like David Robinson's answer here a lot, here's some additional critique of k-means.

Clustering non-clustered data

Run k-means on uniform data, and you will still get clusters! It doesn't tell you when the data just does not cluster, and can take your research into a dead end this way.

K-means on uniform data

Sensitive to scale

Rescaling your datasets will completely change results. While this itself is not bad, not realizing that you have to spend extra attention to scaling your data is bad. Scaling factors are extra $d$ hidden parameters in k-means that "default" to 1 and thus are easily overlooked, yet have a major impact (but of course this applies to many other algorithms, too).

This is probably what you referred to as "all variables have the same variance". Except that ideally, you would also consider non-linear scaling when appropriate.

Also be aware that it is only a heuristic to scale every axis to have unit variance. This doesn't ensure that k-means works. Scaling depends on the meaning of your data set. And if you have more than one cluster, you would want every cluster (independently) to have the same variance in every variable, too.

Here is a classic counterexample of data sets that k-means cannot cluster. Both axes are i.i.d. in each cluster, so it would be sufficient to do this in 1 dimension. But the clusters have varying variances, and k-means thus splits them incorrectly.

K-means cannot cluster this data set

I don't think this counterexample for k-means is covered by your points:

  • All clusters are spherical (i.i.d. Gaussian).
  • All axes have the same distribution and thus variance.
  • Both clusters have 500 elements each.

Yet, k-means still fails badly (and it gets worse if I increase the variance beyond 0.5 for the larger cluster) But: it is not the algorithm that failed. It's the assumptions, which don't hold. K-means is working perfectly, it's just optimizing the wrong criterion.

Even on perfect data sets, it can get stuck in a local minimum

Below is the best of 10 runs of k-means on the classic A3 data set. This is a synthetic data set, designed for k-means. 50 clusters, each of Gaussian shape, reasonably well separated. Yet, it only with k-means++ and 100 iterations I did get the expected result... (below is 10 iterations of regular k-means, for illustration).

k-means on A3 data set

You'll quickly find many clusters in this data set, where k-means failed to find the correct structure. For example in the bottom right, a cluster was broken into three parts. But there is no way, k-means is going to move one of these centroids to an entirely different place of the data set - it's trapped in a local minimum (and this already was the best of 10 runs!)

And there are many of such local minima in this data set. Very often when you get two samples from the same cluster, it will get stuck in a minimum where this cluster remains split, and two other clusters merged instead. Not always, but very often. So you need a lot of iterations to have a lucky pick. With 100 iterations of k-means, I still counted 6 errors, and with 1000 iterations I got this down to 4 errors. K-means++ by the way it weights the random samples, works much better on this data set.

Means are continuous

While you can run k-means on binary data (or one-hot encoded categorical data) the results will not be binary anymore. So you do get a result out, but you may be unable to interpret it in the end, because it has a different data type than your original data.

Hidden assumption: SSE is worth minimizing

This is essentially already present in above answer, nicely demonstrated with linear regression. There are some use cases where k-means makes perfect sense. When Lloyd had to decode PCM signals, he did know the number of different tones, and least squared error minimizes the chance of decoding errors. And in color quantization of imaged, you do minimize color error when reducing the palette, too. But on your data, is the sum of squared deviations a meaningful criterion to minimize?

In above counterexample, the variance is not worth minimizing, because it depends on the cluster. Instead, a Gaussian Mixture Model should be fit to the data, as in the figure below:

Gaussian Mixture Modeling

(But this is not the ultimate method either. It's just as easy to construct data that does not satisfy the "mixture of k Gaussian distributions" assumptions, e.g., by adding a lot of background noise)

Too easy to use badly

All in all, it's too easy to throw k-means on your data, and nevertheless get a result out (that is pretty much random, but you won't notice). I think it would be better to have a method which can fail if you haven't understood your data...

K-means as quantization

If you want a theoretical model of what k-means does, consider it a quantization approach, not a clustering algorithm.

The objective of k-means - minimizing the squared error - is a reasonable choice if you replace every object by its nearest centroid. (It makes a lot less sense if you inspect the groups original data IMHO.)

There are very good use cases for this. The original PCM use case of Lloyd comes to mind, or e.g. color quanization (Wikipedia). If you want to reduce an image to k colors, you do want to replace every pixel with the nearest centroid. Minimizing the squared color deviation then does measure L2 optimality in image approximation using $k$ colors only.

This quantization is probably quite similar to the linear regression example. Linear regression finds the best linear model. And k-means finds (sometimes) the best reduction to k values of a multidimensional data set. Where "best" is the least squared error.

IMHO, k-means is a good quantization algorithm (see the first image in this post - if you want to approximate the data set to two points, this is a reasonable choice!). If you want to do cluster analysis as in discover structure then k-means is IMHO not the best choice. It tends to cluster when there are not clusters, and it cannot recognize various structures you do see a lot in data.


Fine print: all images were generated with ELKI. Data were generated using the .xml data generation format, but they are so basic it is not worth sharing them.

$\endgroup$
8
  • 21
    $\begingroup$ (Just to note - it's probably not a good idea to talk about the "above answer", since the answer order that a reader sees can be variable. For instance, if they set the display order to "active", then your answer is actually the one above!) $\endgroup$
    – Silverfish
    Commented Jan 17, 2015 at 23:18
  • 3
    $\begingroup$ @Anony-Mousse This answer is really awesome. But until now, I kind of forget what do we usually mean by saying "k-means will work under some conditions and will fail under other conditions." What do the word "work" or "fail" mean in this context? Does "work" means the solution generated by k-means will visually 'looks reasonable'? This is kind of vague. Or 'work' mean if k-means provide solution which is the same as the 'standard solution' i.e., we pre-generate a data set and use k-means. In this context 'work' makes sense, but in reality, data are not pre-generated by some distribution. $\endgroup$
    – KevinKim
    Commented Jan 23, 2015 at 2:24
  • $\begingroup$ Usually people refer to some ground truth, i.e. how the data was generated or to some label hidden from the algorithm. Comparing to generated data will prefer algorithms that optimize the model that was used for generation (e.g. GMM and k-means for Gaussians). And even on real and labeled data this evaluation is about reproducing a known result. When you consider the explorative / knowledge discovery aspect, where you want to learn something new. But it's all we've got. $\endgroup$ Commented Jan 23, 2015 at 7:07
  • $\begingroup$ Would it work better on the A3 data set if $k$ were adjusted to the number of effectively present clusters as determined a priori? $\endgroup$
    – TMOTTM
    Commented Sep 3, 2016 at 11:39
  • $\begingroup$ @TMOTTM this is with k chosen by prior knowledge. Best of 10 runs all with the "correct" k chosen a priori. $\endgroup$ Commented Sep 3, 2016 at 11:43
525
+100
$\begingroup$

What a great question- it's a chance to show how one would inspect the drawbacks and assumptions of any statistical method. Namely: make up some data and try the algorithm on it!

We'll consider two of your assumptions, and we'll see what happens to the k-means algorithm when those assumptions are broken. We'll stick to 2-dimensional data since it's easy to visualize. (Thanks to the curse of dimensionality, adding additional dimensions is likely to make these problems more severe, not less). We'll work with the statistical programming language R: you can find the full code here (and the post in blog form here).

Diversion: Anscombe's Quartet

First, an analogy. Imagine someone argued the following:

I read some material about the drawbacks of linear regression- that it expects a linear trend, that the residuals are normally distributed, and that there are no outliers. But all linear regression is doing is minimizing the sum of squared errors (SSE) from the predicted line. That's an optimization problem that can be solved no matter what the shape of the curve or the distribution of the residuals is. Thus, linear regression requires no assumptions to work.

Well, yes, linear regression works by minimizing the sum of squared residuals. But that by itself is not the goal of a regression: what we're trying to do is draw a line that serves as a reliable, unbiased predictor of y based on x. The Gauss-Markov theorem tells us that minimizing the SSE accomplishes that goal- but that theorem rests on some very specific assumptions. If those assumptions are broken, you can still minimize the SSE, but it might not do anything. Imagine saying "You drive a car by pushing the pedal: driving is essentially a 'pedal-pushing process.' The pedal can be pushed no matter how much gas in the tank. Therefore, even if the tank is empty, you can still push the pedal and drive the car."

But talk is cheap. Let's look at the cold, hard, data. Or actually, made-up data.

enter image description here

This is in fact my favorite made-up data: Anscombe's Quartet. Created in 1973 by statistician Francis Anscombe, this delightful concoction illustrates the folly of trusting statistical methods blindly. Each of the datasets has the same linear regression slope, intercept, p-value and $R^2$- and yet at a glance we can see that only one of them, I, is appropriate for linear regression. In II it suggests the wrong shape, in III it is skewed by a single outlier- and in IV there is clearly no trend at all!

One could say "Linear regression is still working in those cases, because it's minimizing the sum of squares of the residuals." But what a Pyrrhic victory! Linear regression will always draw a line, but if it's a meaningless line, who cares?

So now we see that just because an optimization can be performed doesn't mean we're accomplishing our goal. And we see that making up data, and visualizing it, is a good way to inspect the assumptions of a model. Hang on to that intuition, we're going to need it in a minute.

Broken Assumption: Non-Spherical Data

You argue that the k-means algorithm will work fine on non-spherical clusters. Non-spherical clusters like... these?

enter image description here

Maybe this isn't what you were expecting- but it's a perfectly reasonable way to construct clusters. Looking at this image, we humans immediately recognize two natural groups of points- there's no mistaking them. So let's see how k-means does: assignments are shown in color, imputed centers are shown as X's.
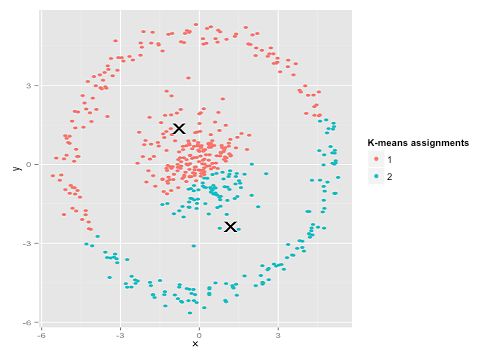
enter image description here

Well, that's not right. K-means was trying to fit a square peg in a round hole- trying to find nice centers with neat spheres around them- and it failed. Yes, it's still minimizing the within-cluster sum of squares- but just like in Anscombe's Quartet above, it's a Pyrrhic victory!

You might say "That's not a fair example... no clustering method could correctly find clusters that are that weird." Not true! Try single linkage hierachical clustering:
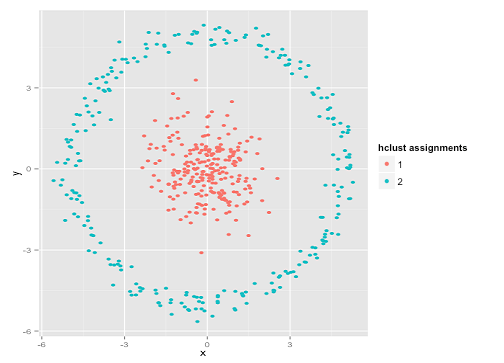
enter image description here

Nailed it! This is because single-linkage hierarchical clustering makes the right assumptions for this dataset. (There's a whole other class of situations where it fails).

You might say "That's a single, extreme, pathological case." But it's not! For instance, you can make the outer group a semi-circle instead of a circle, and you'll see k-means still does terribly (and hierarchical clustering still does well). I could come up with other problematic situations easily, and that's just in two dimensions. When you're clustering 16-dimensional data, there's all kinds of pathologies that could arise.

Lastly, I should note that k-means is still salvagable! If you start by transforming your data into polar coordinates, the clustering now works:

enter image description here

That's why understanding the assumptions underlying a method is essential: it doesn't just tell you when a method has drawbacks, it tells you how to fix them.

Broken Assumption: Unevenly Sized Clusters

What if the clusters have an uneven number of points- does that also break k-means clustering? Well, consider this set of clusters, of sizes 20, 100, 500. I've generated each from a multivariate Gaussian:

enter image description here

This looks like k-means could probably find those clusters, right? Everything seems to be generated into neat and tidy groups. So let's try k-means:

enter image description here

Ouch. What happened here is a bit subtler. In its quest to minimize the within-cluster sum of squares, the k-means algorithm gives more "weight" to larger clusters. In practice, that means it's happy to let that small cluster end up far away from any center, while it uses those centers to "split up" a much larger cluster.

If you play with these examples a little (R code here!), you'll see that you can construct far more scenarios where k-means gets it embarrassingly wrong.

Conclusion: No Free Lunch

There's a charming construction in mathematical folklore, formalized by Wolpert and Macready, called the "No Free Lunch Theorem." It's probably my favorite theorem in machine learning philosophy, and I relish any chance to bring it up (did I mention I love this question?) The basic idea is stated (non-rigorously) as this: "When averaged across all possible situations, every algorithm performs equally well."

Sound counterintuitive? Consider that for every case where an algorithm works, I could construct a situation where it fails terribly. Linear regression assumes your data falls along a line- but what if it follows a sinusoidal wave? A t-test assumes each sample comes from a normal distribution: what if you throw in an outlier? Any gradient ascent algorithm can get trapped in local maxima, and any supervised classification can be tricked into overfitting.

What does this mean? It means that assumptions are where your power comes from! When Netflix recommends movies to you, it's assuming that if you like one movie, you'll like similar ones (and vice versa). Imagine a world where that wasn't true, and your tastes are perfectly random- scattered haphazardly across genres, actors and directors. Their recommendation algorithm would fail terribly. Would it make sense to say "Well, it's still minimizing some expected squared error, so the algorithm is still working"? You can't make a recommendation algorithm without making some assumptions about users' tastes- just like you can't make a clustering algorithm without making some assumptions about the nature of those clusters.

So don't just accept these drawbacks. Know them, so they can inform your choice of algorithms. Understand them, so you can tweak your algorithm and transform your data to solve them. And love them, because if your model could never be wrong, that means it will never be right.

$\endgroup$
13
  • 58
    $\begingroup$ +1 for this passionate answer. I particularly enjoyed the polar transformation example, those clever tricks never stop to amaze my mathematically ignorant brain. $\endgroup$
    – mugen
    Commented Jan 16, 2015 at 11:16
  • 26
    $\begingroup$ + 1, this is an absolutely beautiful answer that does a great job of showing how the assumptions break down without getting bogged down in the details of the analysis. $\endgroup$ Commented Jan 16, 2015 at 15:05
  • 17
    $\begingroup$ +1 One of the common things people keep complaining to me is that theoretical things don't work in practice. But when I ask "does your data fit the assumptions of the model?" I simply get a blank look from their faces. Your answer and especially the final section made me really happy. $\endgroup$ Commented Jan 17, 2015 at 13:19
  • 10
    $\begingroup$ +1 Wow, I have been around for a while but I think I have never seen an answer to get 50+ upvotes in one day. This is a truly impressive achievement. $\endgroup$
    – amoeba
    Commented Jan 17, 2015 at 15:15
  • 7
    $\begingroup$ The polar transform, as I see it, is mainly useful here as a first and jargon-free example towards kernel clustering techniques -- where this kind of pre-transformation is how to get linear learning methods to work. $\endgroup$ Commented Jan 19, 2015 at 7:55
14
$\begingroup$

Logically speaking, the drawbacks of K-means are :

  • needs linear separability of the clusters
  • need to specify the number of clusters
  • Algorithmics : Loyds procedure does not converge to the true global maximum even with a good initialization when there are many points or dimensions

But K-means is better than we usually think. I've become quite enthusiastic about it after testing it against other clustering methods (spectral, density...) and LDA in real life text classification of one million texts : K-means had far better accuracy than LDA for example (88% vs 59%). Some other clustering methods were good, but K-means was close to the top... and more affordable in terms of complexity.

I've never read about a clustering method that is universally better on a wide range of problems. Not saying K-means is universally better either, just that there is no universal clustering superhero as far as I know. Many articles, many methods, not a true revolution (in my personal limited experience of testing some of them).

The main reason why the logical drawbacks of K-means are often only apparent is that clustering points in a 2D plane is something you rarely do in machine learning. Many things from geometric intuition that is true in 2D, 3D... are irrelevant in rather high dimension or abstract vector spaces (like bag of words, vector of variables...)

Linear separability : You rarely have to deal with circular clusters in real life data. It's even better to assume they do not exist in these cases. Allowing your algorithm to search for them would allow it to find odd circular clusters in the noise. The linear assumption in K-means makes it often more robust.

Number of clusters : There is often no true ideal number of clusters that you wish to see. For text classification for example, there may be 100 categories, 105, 110... it's all rather subjective. Specifying the number of clusters becomes equivalent to specifying a global granularity. All clustering methods need a granularity specification anyway.

Global maximum : I think it's a true issue. The true abstract K-means that would consist in finding the global minimum for the S.O.D is fundamentally NP-Hard. Only Lloyd is affordable and it is... very imperfect. We have really seen that being close to the real minimum (thanks to replications) clearly improved the quality of the results. Replication of the K-means is an improvement but not a perfect solution. For a big dataset you would need $10^{\text{a lot}}$ replications to have a small chance to find the true minimum. Others methods like "finish it with greedy search" (proposed in Matlab) are astronomically costly in big datasets.

But all clustering algorithms have such limitations. For example in Spectral clustering: you can't find the true eigenvectors, only approximations.

For the same computation time, a quite optimized LDA library did less good than our home-made (not perfectly optimized) K-means. Since then, I think a bit differently.

$\endgroup$
10
$\begingroup$

I would just like to add to @DavidRobinson's answer that clustering to minimal total cluster variance is actually a combinatorial optimization problem, of which k-Means is just one technique - and given the latter's "one shot", local "steepest descent" nature, a pretty bad one too. Also, trying to substantially improve the "bare bones" k-Means by somehow (but quickly!) figuring out where the cluster seeds should be, is doomed from the outset: since the seeds impact (drastically!) the final clusters, it amounts to "knowing" what the optimum is... before actually computing it.

However, as most optimization problems, it may nevertheless be amenable to some serious optimization technique. One of them very closely fits the structure of the problem (as the NFL requires!), and it certainly shows in its outcomes. I don't want to make any ads here (it would be - and rightly so - against etiquette), so if you're interested, just read it here and make your own judgement.

That being said, I agree with @ttnphns that k-Means certainly does not identify a Gaussian Mixture - the cost functions of the two problems are completely different. It turns out that finding the best-fitting (in terms of probability of the model given the data) Gaussian Mixture is also a combinatorial optimization problem - and one for which a serious optimization technique exists as well. Once again, no ads: you can reach your own conclusion here - I will just say that the algorithm discussed there can, indeed, correctly identify clusters like the last image in @DavidRobinson's post. It even correctly (i.e., in a mathematically well-defined way) solves the perennial problem of outliers, i.e., data points that do not belong to any of the clusters because they're just completely random (notoriously, they completely derail k-Means for instance). This is done by having one additional, uniform distribution compete with the Gaussians... and the splendid result is that on uniformly distributed data, it indeed reports there's nothing in there (I've never seen that anywhere else).

Now obviously, according to the NFL, and as your rightly pointed out, even globally optimal Gaussian Mixtures with outlier identification do rely on a prior assumption - namely that the data are, indeed, distributed normally. Fortunately though, thanks to the Law of Large Numbers, numerous natural phenomena do comply with that assumption.

DISCLAIMER: with my deepest apologies, I wrote both of the papers above, and the algorithms they discuss.

P.S. I met Macready in a conference once - an extremely bright and nice guy!

$\endgroup$
4
  • $\begingroup$ This is suppose to be an answer to the question. $\endgroup$ Commented Feb 13, 2017 at 4:45
  • 3
    $\begingroup$ It actually IS an answer, Michael: k-Means PRETENDS to solve what is actually a combinatorial optimization problem... yet it definitely does NOT (not seriously in any way)! Also, k-Means assumes (by design) spherical distributions, which are so lame it would make you cry (multiply one of the dimensions by two, and get something completely different, whatever your "smart" seeds!). And the question of outliers (present in ANY real-world data I've seen!) is simply not even addressed in k-Means, even though they completely destroy whatever pretension k-Means could have of "serious" clustering. $\endgroup$ Commented Feb 13, 2017 at 5:27
  • 1
    $\begingroup$ @EmanuelFalkenauer, welcome to the site. I'm voting (+1) for your answer, but it is just a little bit pretentious. How can K-mean pretend something of for something, it being not a human? It does what it does, and does it not bad, for a simple/fast method. $\endgroup$
    – ttnphns
    Commented Feb 13, 2017 at 10:01
  • 1
    $\begingroup$ @ttnphns: Thanks for the welcome, and the upvote! Well of course that k-Means does not pretend anything (it's just a piece of code - my bad!), but people promoting it do - as the OP found out. I agree with your pointing out that it's a "simple/fast" method - but the big trouble is that relying on its output on any but the most simplistic data is close to suicidal: not only does it make assumptions that are not complied with most of the time, but even when they are, it does a terrible job. You just don't solve a combinatorial problem with a steepest descent. ;-) $\endgroup$ Commented Feb 14, 2017 at 2:30
7
$\begingroup$

To understand the drawbacks of K-means, I like to think of what the model behind it is.

K-means is a special case of Gaussian Mixture Models (GMM). GMM assumes that the data comes from a mixture of $K$ Gaussian distributions. In other words, there is a certain probability that the data comes from one of $K$ of the Gaussian distributions.

If we make the the probability to be in each of the $K$ Gaussians equal and make the covariance matrices to be $\sigma^2 \mathbf{I}$, where $\sigma^2 $ is the same fixed constant for each of the $K$ Gaussians, and take the limit when $\sigma^2 \rightarrow 0$ then we get K-means.

So, what does this tell us about the drawbacks of K-means?

  1. K-means leads to clusters that look multivariate Gaussian.
  2. Since the variance across the variables is the same, K-means leads to clusters that look spherical.
  3. Not only do clusters look spherical, but since the covariance matrix is the same across the $K$ groups, K-means leads to clusters that look like the same sphere.
  4. K-means tends towards equal sized groups.

K-means is actually quite a restrictive algorithm. The advantage being that with the assumptions above, you can perform the algorithm quite quickly. But if clustering performance is your top concern, K-means is usually way too restrictive in real situations.

$\endgroup$
4
  • 3
    $\begingroup$ I can't fully agree. Claim K-means to be a particular case of Gaussian mixture is a far stretch. K-means does not assume a specific type of distribution, such as normal (therefore it is not probabilistic ground). It does assume nonoverlapping clusters (i.e. no "mix"). It assumes spherical clusters but more precise to say it assumes convex polygons of Voronoi cells. Maybe it is right to say K-means does not "model" anything, it has no direct reference to a data generating process. K-means "tends towards equal sized [by the number of points] groups" - not necessarily. $\endgroup$
    – ttnphns
    Commented Dec 2, 2016 at 17:09
  • 5
    $\begingroup$ @ttnphns It can be shown that k-means is indeed a special case of GMM: en.wikipedia.org/wiki/K-means_clustering#Gaussian_Mixture_Model $\endgroup$ Commented Dec 2, 2016 at 17:31
  • $\begingroup$ It can be shown that. By sufficient stretch, anything can be "shown" as kinship, beyond reason. $\endgroup$
    – ttnphns
    Commented Dec 2, 2016 at 17:42
  • 3
    $\begingroup$ @ttnphns No, everything cannot be mathematically shown. $\endgroup$ Commented Dec 7, 2016 at 16:59

Your Answer

By clicking “Post Your Answer”, you agree to our terms of service and acknowledge you have read our privacy policy.

Not the answer you're looking for? Browse other questions tagged or ask your own question.