3
$\begingroup$

I am new to R and and random regression forest. Right now I am working with a dataset of 60 input variables (dummy variables and continuous variables) and try to find the most important variables, which describe my dependent variable best. Therefore I am using the permutation-based OOB-MSE.

My problem is now, that each time I run the random forest, the ranking of the variables changes even when I just repeat the command with the same amount of ntree and mtry. First I was thinking that it had something to do with the randomized number of variables used in each tree, so I increased ntree. However, this also didn't help... Has anybody an idea what the problem might be and how I can get stable results for the variable importance measure?

Thanks!

$\endgroup$

3 Answers 3

4
$\begingroup$

There are a few things that can effect importance.

If the variables in your data set are correlated there can be a lot of instability in the variable importance as the model can use the variables somewhat interchangeably. Ideally it will spread the importance over all of the correlated variables but in practice it may require a lot of trees for this to happen. Reducing mTry or using extra/totally randomized trees is one way to combat this though this may hurt you're prediction accuracy or at least require re tuning...the most accurate model may not be the best for identifying feature importance.

Masking scores and other methods for explicitly dealing with correlated features have also been proposed.

You could also try doing dimensionality reduction before building you're models but this may destroy some of the non linear etc structure in the data depending on how you do it.

There are also biases in CART style feature selection towards "high cardinality" or sparse features. These features tend to be able to produce decreases in impurity that don't generalize well by random chance.

Further I'd only ever expect the importance ranking to be consistent for the top few features which get used across most of the bagged trees. The less useful features will get used less and have a lot more variability.

[2]: Also here: https://eranraviv.com/random-forest-importance-measures-are-not-important/

$\endgroup$
2
$\begingroup$

Random Forests are stochastic by nature, so it is normal that the results slightly change from run to run. However, the differences should be very small, especially for measures like Variable Importance (either Gini or mean decrease in accuracy) that are stabilized by being averaged over all trees.

First I was thinking that it had something to do with the randomized number of variables used in each tree, so I increased ntree

The ntree parameter does not control the size of the subset of variables that are randomly tried at each split. The mtry parameter does.

I suspect that there is an issue with your ntree and mtry parameters. If you try only a few variables at each split, and your ntree is not high enough, some variables won't be given a chance to play a role in each tree. This could lead to some instability in the variable importance measures. This is especially true if you have a low mtry, and a lot of important predictors. But there might be other reasons.

You should perform a grid search to tune ntree and mtry based on the OOB error rate first. Or, based on a decent number of trees (to ensure convergence), e.g., 500, you can use the tuneRF function to optimize mtry. Then, once you have your best model, you can use its output (e.g., variable importance measures).

$\endgroup$
6
  • $\begingroup$ Yes I always use tuneRF to optimize my model and I even tried to run it with, e.g. 2000 trees: bestmtry <- tuneRF(D[,2:NCOL(D)],D$y, ntreeTry=2000, stepFactor=1.5,improve=0.01, trace=TRUE, plot=TRUE, dobest=FALSE) rf<-randomForest(y~.,data=D, ntree=2000, mtry=22, importance=T, proximity=T, replace=T, do.trace=T, keep.forest=T, na.action="na.omit"). Is there maybe an issue in my command? Furthermore, even the optimal model has a low R², so could be the reason for the changing of the ranking that my model just doesn't explain the dependent variable well? $\endgroup$
    – Alex_cgn
    Commented Apr 22, 2015 at 15:57
  • $\begingroup$ Your commands seem fine to me. How much observations and predictors do you have? How do you get the importance measures? importance? varImpPlot? Especially, for the latter, see the sort, scale, and n.var parameters. If your covariates are really doing a poor job predicting the outcome, or if your data is very noisy, that could explain the variability. But I would expect at least one predictor or two to stay always on top. What is the amount of variation you observe from run to run? Is it totally random? $\endgroup$
    – Antoine
    Commented Apr 22, 2015 at 16:15
  • $\begingroup$ I just saw that you are using a mix of binary and continuous variables. The binary variables should maybe be entered as factors, to make sure that RF differentiate between them and the continuous ones $\endgroup$
    – Antoine
    Commented Apr 22, 2015 at 16:19
  • $\begingroup$ Great thank you for your help @user2835597. I ran the model with a subset of 10 input variables (and 340 observations) and you are right, the first two most important variables stay the same as well as the three last variables. Only the ones in between change. Then I should probably derive that the top variables are important, but I should not insist on the order of the variables, right? And regarding the measurement, I use both importance and varImpPlot and for both of them I always get the same results, so I guess that is fine... $\endgroup$
    – Alex_cgn
    Commented Apr 23, 2015 at 6:41
  • $\begingroup$ OK so it seems that you have two covariates that are really contributing to the predictive accuracy, 3 that have close to zero importance, and some mildly important input variables in the middle. Do these results carry over when you use the full set of 60 predictors? What matters the most is the relative importance of the variables. If you observe a lot of variations among variables that are not important at all compared to the top ones, you don't care, it's probably just noise/randomness. If you observe variation for variables that do have some relative importance, something may be wrong. $\endgroup$
    – Antoine
    Commented Apr 23, 2015 at 7:38
0
$\begingroup$

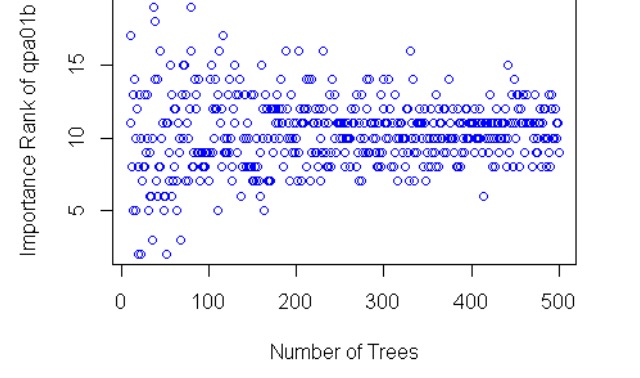
I've been dealing with this same issue. Importance rankings change when I randomly stratify on the dependent variable. I looped through 10 to 500 trees random forest models.enter image description here I get convergence but when I randomly select a training data set the importance rank changed dramatically. So this methodology seems to work well in identifying the top feature selection but it's not stable if you're trying to standardize a methodology for relative importance. Covariance can be measured better in other ways. Random Forests are really good at giving you suggestions. I wouldn't rely solely on a single random forest

$\endgroup$

Your Answer

By clicking “Post Your Answer”, you agree to our terms of service and acknowledge you have read our privacy policy.

Not the answer you're looking for? Browse other questions tagged or ask your own question.