36
$\begingroup$

I'm pretty new to statistics and I need your help.
I have a small sample, as follows:

      H4U
      0.269
      0.357
      0.2
      0.221
      0.275
      0.277
      0.253
      0.127
      0.246

I ran the Shapiro-Wilk test using R:

shapiro.test(precisionH4U$H4U)

and I got the following result:

W = 0.9502, p-value = 0.6921

Now, if I assume the significance level at 0.05 than the p-value is larger then alpha (0.6921 > 0.05) and I cannot reject the null hypothesis about the normal distribution, but does it allow me to say that the sample has a normal distribution?

$\endgroup$

6 Answers 6

34
$\begingroup$

No - you cannot say "the sample has a normal distribution" or "the sample comes from a population which has a normal distribution", but only "you cannot reject the hypothesis that the sample comes from a population which has a normal distribution".

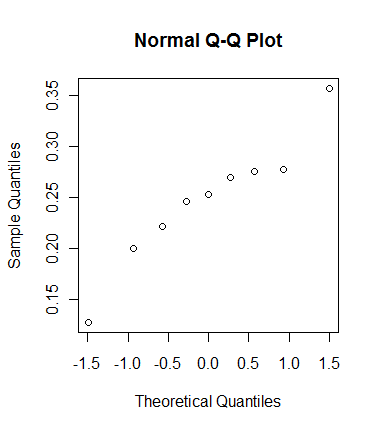
In fact the sample does not have a normal distribution (see the qqplot below), but you would not expect it to as it is only a sample. The question as to the distribution of the underlying population remains open.

qqnorm( c(0.269, 0.357, 0.2, 0.221, 0.275, 
          0.277, 0.253, 0.127, 0.246) )

qqplot

$\endgroup$
7
  • 2
    $\begingroup$ the qqplot looks pretty like normal i think... you can try qqnorm(rnorm(9)) several times... $\endgroup$
    – Tomas
    Commented Sep 21, 2011 at 7:31
  • 4
    $\begingroup$ @Tomas: Perhaps better to say "the qqplot looks as if it could have come from a normal population". It might instead have come from a distribution with heavier tails. $\endgroup$
    – Henry
    Commented Sep 21, 2011 at 13:48
  • $\begingroup$ Yes, qqnorm(runif(9)) can produce similar result. So we cannot actually say anything... $\endgroup$
    – Tomas
    Commented Sep 21, 2011 at 13:55
  • 2
    $\begingroup$ A normal distribution is a continuous distribution over all the reals. A sample (finite or even countably infinite) cannot have this kind of distribution itself, even if it is drawn from a population having this distribution. $\endgroup$
    – Henry
    Commented Dec 16, 2013 at 22:11
  • 1
    $\begingroup$ Actually evidence shows that SW test is more powerful than KS test (based on QQplot). You plot QQ, but without confidence intervals. $\endgroup$ Commented Jan 22, 2020 at 16:58
20
$\begingroup$

Failing to reject a null hypothesis is an indication that the sample you have is too small to pick up whatever deviations from normality you have - but your sample is so small that even quite substantial deviations from normality likely won't be detected.

However a hypothesis test is pretty much beside the point in most cases that people use a test of normality for - you actually know the answer to the question you are testing - the distribution of the population from your data are drawn is not going to be normal. (It might be pretty close sometimes, but actually normal?)

The question you should care about isn't 'is the distribution they're drawn from normal' (it won't be). The question you actually should care about is more like 'is the deviation from normality I have going to materially impact my results?'. If that's potentially an issue, you might consider an analysis that's less likely to have that problem.

$\endgroup$
0
12
$\begingroup$

Considering that you are pretty new to statistics, I suspect that you are thinking about this because these are residuals of an estimate of a mean and you want to know whether the assumption of normality is valid for confidence estimates using a $t$-distribution.

$t$-tests are quite robust to violations of this assumption, the data look vaguely normal in Henry's q-q plot, and the Shapiro test doesn't indicate that the data come from a population with a non-normal distribution, so I would say that a $t$-test is appropriate.

I further speculate that you are looking at proportions, in which case you could use a binomial distribution if you were concerned about violations of assumptions.

If it was some other concern that got you to Shapiro tests, you can ignore everything I just said.

$\endgroup$
0
4
$\begingroup$

As Henry already said you can't say it's normal. Just try to run the following command in R several times:

shapiro.test(runif(9)) 

This will test the sample of 9 numbers from uniform distribution. Many times the p-value will be much larger than 0.05 - which means that you cannot conclude that the distribution is normal.

$\endgroup$
4
$\begingroup$

I was also looking on how to properly interpret W value in Shapiro-Wilk test and according to Emil O. W. Kirkegaard's article "W values from the Shapiro-Wilk test visualized with different datasets" it's very difficult to say anything about the normality of a distribution looking at W value alone.

As he states in conclusion:

Generally we see that given a large sample, SW is sensitive to departures from non-normality. If the departure is very small, however, it is not very important.

We also see that it is hard to reduce the W value even if one deliberately tries. One needs to test extremely non-normal distribution in order for it to fall appreciatively below .99.

See original article for more information.

$\endgroup$
2
$\begingroup$

One important issue not mentioned by previous answer are the test limitations:

The test has limitations, most importantly that the test has a bias by sample size. The larger the sample, the more likely you’ll get a statistically significant result.

To answer the original question (very small sample size): see the following articles about better alternatives like QQ plot and histogram for this specific case.

$\endgroup$
1
  • 1
    $\begingroup$ This "bias by sample size" is a feature of literally every hypothesis testing procedure! $\endgroup$
    – whuber
    Commented May 4, 2022 at 14:02

Not the answer you're looking for? Browse other questions tagged or ask your own question.