1
$\begingroup$

Suppose I know that the true population proportion of a mutation is p = 0.3493119. I want to know that given power = 0.8, what's the proportion of of mutation in my sample of n = 30? Here's what I have so far:

1 - cdf((x-p)/sqrt(p*(1-p)/30) = 0.8 Since p = 0.3493119, I can solve for x and I get x = 0.276055. So does this mean that the probability of having 27.6% of the sample be mutated = 0.8? Is it correct to say that?

From my experience I know that power is the probability of correctly rejecting the null. But since I already know the true population proportion of the mutation, is it still necessary to conduct a hypothesis test? I am leaning towards the negative, but without a hypothesis test, how can I calculate the power?

If I had to perform a hypothesis test to get the power...would it be something like this:

H0: p = 0.5 vs. H1: p > 0.5

power = P(Z_statistic > critical_value | p > 0.5)

power = 1 - normal_CDF(critical_value | p > 0.5)

Now I'm confused by how to deal with the p > 0.5, if it were just p = 0.5, I could've standardized the critical value so that it follows a N(0, 1) distribution.

Overall I think I just want to know the answer to the question, given power = 0.8, what is the proportion of mutation in my sample of n = 30? (true population proportion = 0.3493119).

$\endgroup$
3
  • $\begingroup$ I think your hypothese should be Ho: p=0.3493139 and H1:p>0.3493139, Something like that. Since you already stated that the true population proportion is 0.3493119, test p=0.5 vs. p>0.5 seems very strange to me. $\endgroup$
    – Deep North
    Commented Jun 17, 2015 at 0:58
  • $\begingroup$ @DeepNorth Ok. So power = P(Z > critical value | p > 0.3493139) correct? How do I proceed to find the power? How do I standardize the critical value? Let critical value = c. Would I just do (c - p)/sqrt(p * (1-p) / 30) to standardize the critical value? $\endgroup$
    – Adrian
    Commented Jun 17, 2015 at 1:10
  • 1
    $\begingroup$ To calcuate a specific power, you also need a specific effect size and type I error level, if you do not have a specific effect size, you can draw a power curve, think. $\endgroup$
    – Deep North
    Commented Jun 17, 2015 at 1:15

3 Answers 3

1
$\begingroup$

I would say "Yes"power is alway associated with hypothesis testing it relates to sample size, type I error and both H1 and H0.

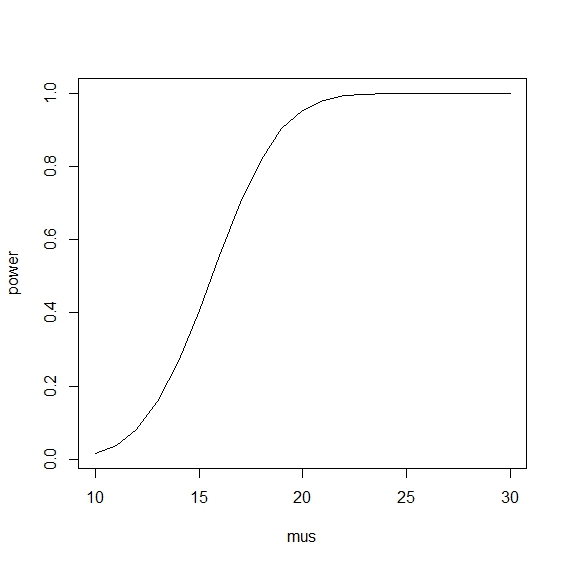
The followings are R code to show the power curve for OP's cases (one tailed at 0.05 level, by approximate a normal distribution.

mu<-30*0.35
sd<-sqrt(30*0.35*(1-0.35))
c<-qnorm(0.95,mu,sd)
mus<-seq(10,30,1)
power = 1-pnorm(c, mus, sd)
plot(mus, power, type="l")

enter image description here

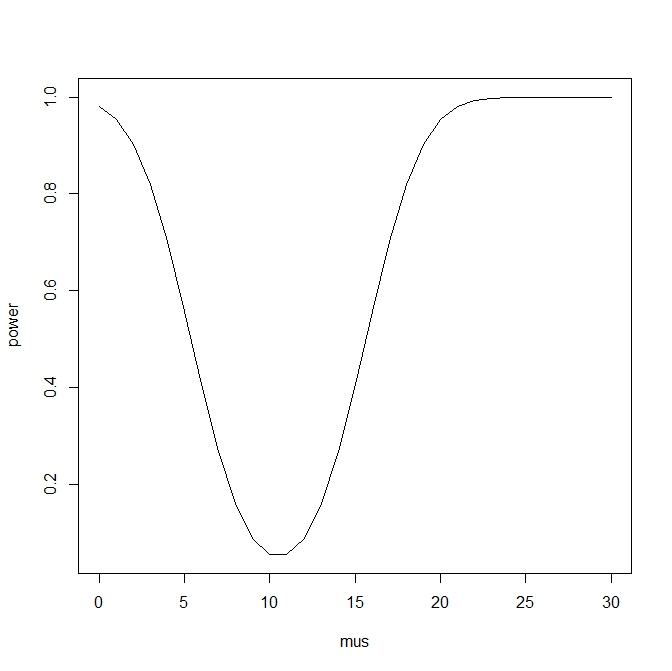
Two tailed case by approximating normal distribution

mu<-30*0.35
sd<-sqrt(30*0.35*(1-0.35))
mu
sd
c1<-qnorm(0.025,mu,sd)
c2<-qnorm(0.975,mu,sd)
mus<-seq(0,30,1)
power2 <- pnorm(c1,mus,sd)+1-pnorm(c2,mus,sd)
plot(mus, power2, type="l")

enter image description here

$\endgroup$
5
  • $\begingroup$ So to attain a power of 0.8, I need p = 0.2? What does p represent? Effect size? $\endgroup$
    – Adrian
    Commented Jun 17, 2015 at 1:46
  • $\begingroup$ Ok, I will modify I answer, it is not clear by using p. $\endgroup$
    – Deep North
    Commented Jun 17, 2015 at 2:46
  • $\begingroup$ Now, supose your mutation rate is p=0.6 which is 18 muations then your power is about 80% to reject H0:p=0.35. $\endgroup$
    – Deep North
    Commented Jun 17, 2015 at 4:30
  • $\begingroup$ Thank you. What if I wanted to do a 2 tailed test? So H1: p =/= 0.35. How would I plot the the power function then? $\endgroup$
    – Catherine
    Commented Jun 17, 2015 at 20:46
  • $\begingroup$ I also included a two tailed power curve. $\endgroup$
    – Deep North
    Commented Jun 18, 2015 at 0:53
0
$\begingroup$

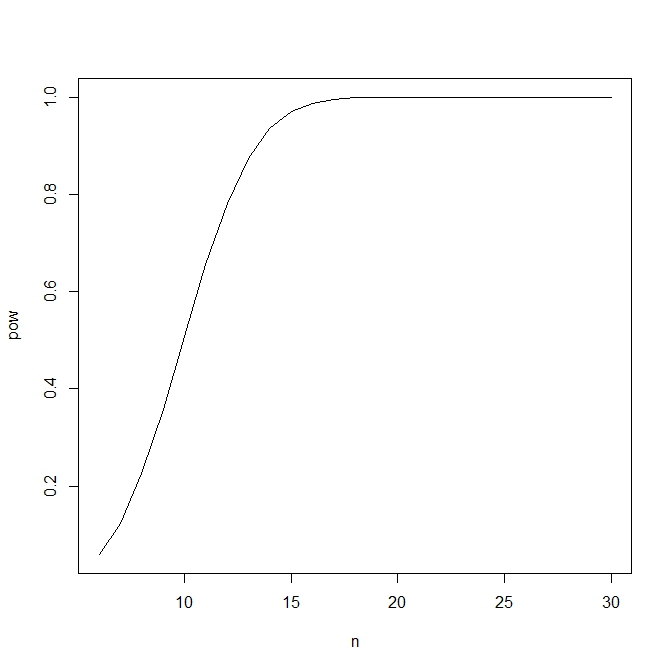
This is for binomail distribution not by approximation.

#under binomail distribution, one tail,
qbinom(0.05,30,0.35) #critical rigion
n<-seq(6,30,1) #numbers bigger than critical region
pow<-pbinom(n,30,0.35)#one tailed test
plot(n, pow, type="l")

enter image description here

$\endgroup$
0
$\begingroup$

Your question is not a question about power. Assuming a given population mean, you are interested in predicting the sample mean. If you have a binomial distribution, you can find the density distribution centered over your population mean.

Power would require specification of a criterion value for deviations of sample means from the population mean.

$\endgroup$

Your Answer

By clicking “Post Your Answer”, you agree to our terms of service and acknowledge you have read our privacy policy.

Not the answer you're looking for? Browse other questions tagged or ask your own question.