5
$\begingroup$

I have a hazard rate given by a 2-parameters Weibull distribution, in the form:

$$h(t) = \cfrac{B}{A} \, \left({\cfrac{t}{A}}\right)^{B - 1}$$

where $A=$ scale parameter and $B=$ shape parameter. I don't have a lot of knowledge about probability distributions, but I would like to use this one to reproduce the famous bathtub curve.

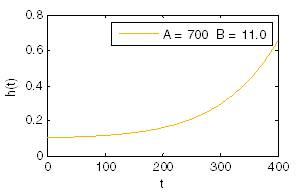
How can I establish the proper value of $A$ and $B$ in order to obtain 3 distributions like these:

enter image description here enter image description here enter image description here

For the green one (constant hazard rate) I know that the ordinate of the line is given by $B/A$, therefore in the example it is 0.1 ($B/A=1/10=0.1$); but for the other two I would like to establish some formula that permits me to establish the value of A and B in order to:

  1. do not exceed never the value of $h(t) = 1$
  2. decrease (or increase) asymptotically until to (from to) the same value of the constant part (e.g. 0.1 in the previous example) so I can "stick" them together at the end like in the following image.

enter image description here

$\endgroup$
2
  • 2
    $\begingroup$ The hazard of a Weibull distribution is always monotonic - increasing, decreasing or staying constant, but not first decreasing and then increasing. So there is no way to "reproduce the famous bathtub curve" for h(t) using a Weibull hazard. Your questions are not clear to me. Your graphs seem to indicate the parameters A and B used to produce them and you have also realised that the intercept will be B/A. You seem to want to have multiple hazard functions to "'stick' them together", but your goal is not clear to me. $\endgroup$
    – Rob Hall
    Commented Jul 15, 2015 at 12:38
  • 1
    $\begingroup$ Hi Rob, thanks for your answer. My goal is to find a relationship that permits me to establish where my curve will start and end depending on the scale and shape that I choose. In the case of the green distribution it was just B/A because it is a constant line. But what in the case of B<1 and B>1? In few words, if I want that my distribution to start from h(t1) = n1 and ends at h(t) = n2, regardless of the shape that it will assume, how can I find a formula that relates n1 and n2 to A and B? (e.g. above end of red line and beginning of yellow are 0.1) $\endgroup$
    – Ggiioo
    Commented Jul 15, 2015 at 12:53

1 Answer 1

5
$\begingroup$

I realize that the question is already three years old, but I think an answer may be of general interest.

I think your question is based on a rather common misconception. The bathtub curve for failure modelling is often being discussed in the literature using three Weibull distributions, one for the infant mortality phase of the curve, one for the random phase, and one for the phase of wear out failures. This is fine conceptually. But trying to build a model based on this same approach of "stitching together" Weibull distributions is a hassle, and, depending on your use case, may not work at all.

Fortunately, there are several approaches to generalizing the Weibull distribution in order to be able to model bathtub curves in practice. Sarhan and Apaloo (2013) may be a good starting point if you're interested in this way of treating the problem.

$\endgroup$

Your Answer

By clicking “Post Your Answer”, you agree to our terms of service and acknowledge you have read our privacy policy.

Not the answer you're looking for? Browse other questions tagged or ask your own question.