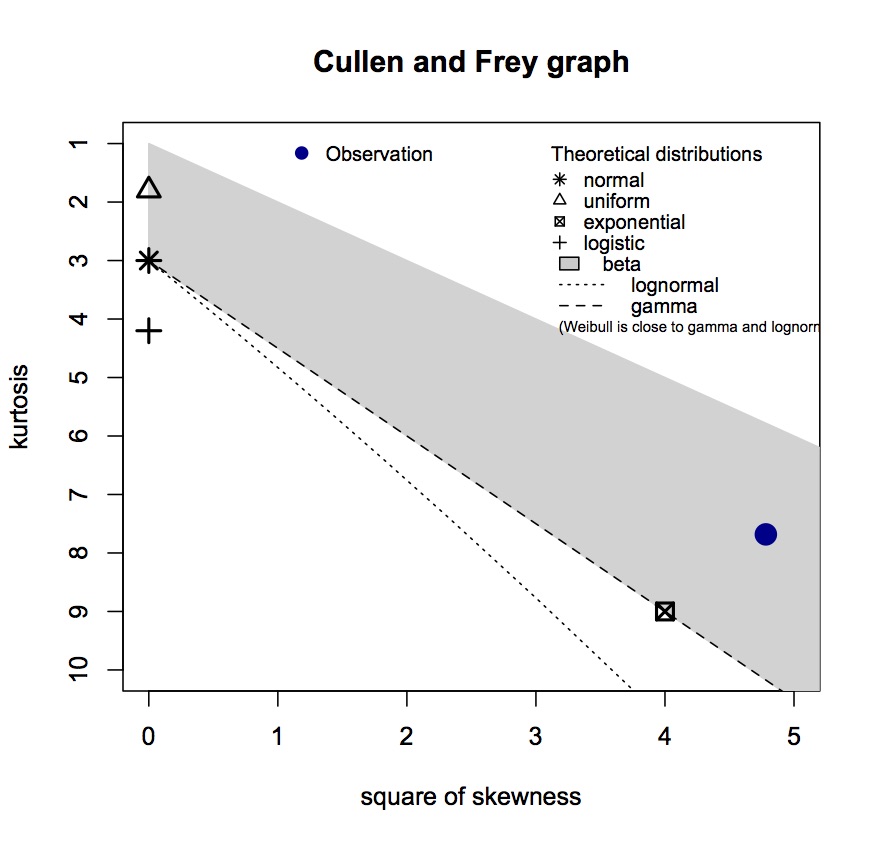
You have count data. The gamma distribution is continuous. As your question anticipates, it would not normally be the case that one would use a continuous distribution to describe discrete data. You can of course discretize continuous distributions on $(0,\infty)$ in various ways to achieve a distribution on the positive integers (such as round up, or round off and then truncate, for example).
It would be more typical to first attempt to describe discrete data with a discrete distribution. However, it's not clear to me that one should expect "number of species per genus" to follow any of the standard discrete distributions; it seems more like some form of birth-and-death process (new species arise -- "birth", and go extinct -- "death"), and surely something like that kind of understanding would inform the choice of distribution, if a specific distribution were actually needed.
It may be that some other process (perhaps something such as a Chinese restaurant process) might happen to give suitable approximations in some situations, but I'd be inclined to start with a natural model like a birth-death process. I don't know a stationary distribution for that (though I think recursion formulas exist for the pmf), but it at least gives a starting point for simulations from which more suitable distributional choices might arise.
Failing that, I'd have started with a heavy-tailed discrete distribution on the positive integers, like a logarithmic series distribution (which has been used for a host of biological problems such as relative species abundance and even species per genus**) or perhaps a zero-truncated negative binomial$^\dagger$.
$\dagger$ [Note that the logarithmic series arises as a special case of the truncated negative binomial, so these aren't really separate suggestions]
Is there a reason you need to identify a distribution at all?
** e.g. see
Williams, C.B. (1964),
Patterns in the balance of nature,
Academic Press, NY
which discusses its use for modelling species per genus and genera per sub-family among other uses.
In response to the revelation of the existence of explanatory variables (rather than just building a univariate model as the question seems to suggest):
If you have several explanatory variables, that's a really important thing to mention; it does give some reason to look at distributional models. But if you do have such IVs for your observations, it means you can't look across observations that might have different values for the IVs in order to try to figure out what the distribution is -- instead of the conditional distribution which is what matters for the model, you'd be looking at the marginal distribution (essentially a mixture of those conditionals). The two may look nothing alike. This means that an exercise akin to the one you carry out in your question is misguided -- if the IVs in your model have any value, consideration of the marginal distribution in order to try to choose a model for the conditional distribution may be pretty much useless.
Incidentally, if you still conclude a logarithmic series distribution is suitable, it appears to be exponential family, so it should be possible to do a generalized linear model to include your covariates. (Actually the R package VGAM looks like it can fit a glm with this distribution, via vglm using the logff family. The default link there is logit, but other links are possible.)

