1
$\begingroup$

I am struggling with interpreting the intensity function for a Matern cluster point process model. From Illian et al. 2008, p. 381 (Statistical Analysis and Modelling of Spatial Point Patterns), it appears that the indicator is summed if a point X of the process is within a disk of radius R surrounding point y of the parent process (Np is the parent point process process). Or perhaps I'm misunderstanding -- perhaps the "1" gets summed if, for a given point, there is one of the parent points within a disk of radius R centered on point X. Lambda_c is the average intensity of the child processes, R is the radius of the disk that's centered, presumably, on the points of the parent process, and yi, I believe, is each parent point. What this would mean is that at any location x, when you want to calculate the intensity, you have to see how many parent points (and thus clusters) there are around it, and the intensity would therefore be that count of nearby parents times the average intensity of the child processes, in the case of superimposed clusters.

My question, therefore: can someone describe exactly what the equation shown here is doing, in the context of the Matern cluster process? See also Stoyan and Penttinen 2000 (Recent Applications of Point Process Methods in Forestry Statistics Statistical Science 15(1): 61-78). Thanks for your help!

enter image description here

$\endgroup$

1 Answer 1

1
$\begingroup$

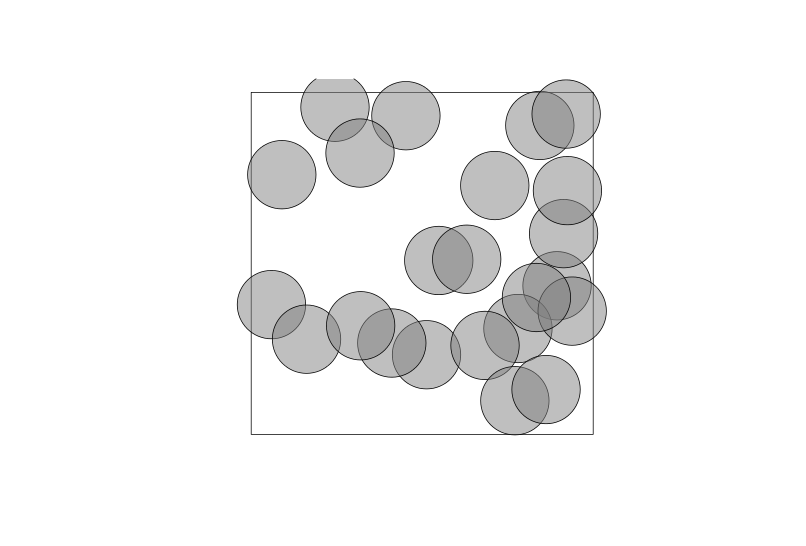
I don't have the book right here, so I can't say for sure from the context, but it appears that you have given the formula for the random driving intensity function of the Matern cluster process when interpreted as an Cox process. I.e. N_p is a Poisson process of random parent locations, and around each of these locations (y) you draw a circle of radius R and from this one parent the intensity function gets the value lambda_c inside the circle and zero outside. Then you add all this functions together for all the parents. Using the R package spatstat you can get a picture of the situation like this (when two circles overlap intensity is 2*lambda_c when three overlap 3*lambda_c etc.):

# Poisson parents in 5x5 square:
Np = rpoispp(1, win=square(5))
# Mark them with the diameter 1:
marks(Np) = 1
# Plot with transparent colours to see overlap:
plot(Np, markscale=1, bg = rgb(.5,.5,.5,.5), legend=FALSE, main = "")

enter image description here

$\endgroup$
3
  • $\begingroup$ and thanks -- so for clarification, the intensity function is thus location centered -- for a given offspring point, the count of parent points "around" it is made (the indicator function), and then one multiplies this count by the average intensity to get the "local intensity"? This seems to make intuitive sense to me. My confusion seems to arise from there being the "construction method" of the process -- where the parents are created, disks of radius R are created, and then the second subsample of a Poisson process is made and put within the circle (lambda_c) and the parents are then remove $\endgroup$ Aug 13, 2015 at 15:38
  • $\begingroup$ Andy's comment got truncated: the end was: "are then removed, VS. the idea that once you have the intensity constructed and you want to model the intensity function, you go to each location to evaluate and look "around" it. Am I on base with this?" $\endgroup$ Aug 13, 2015 at 16:46
  • $\begingroup$ Sounds like you got it right. $\endgroup$
    – Ege Rubak
    Aug 13, 2015 at 23:14

Your Answer

By clicking “Post Your Answer”, you agree to our terms of service and acknowledge you have read our privacy policy.

Not the answer you're looking for? Browse other questions tagged or ask your own question.