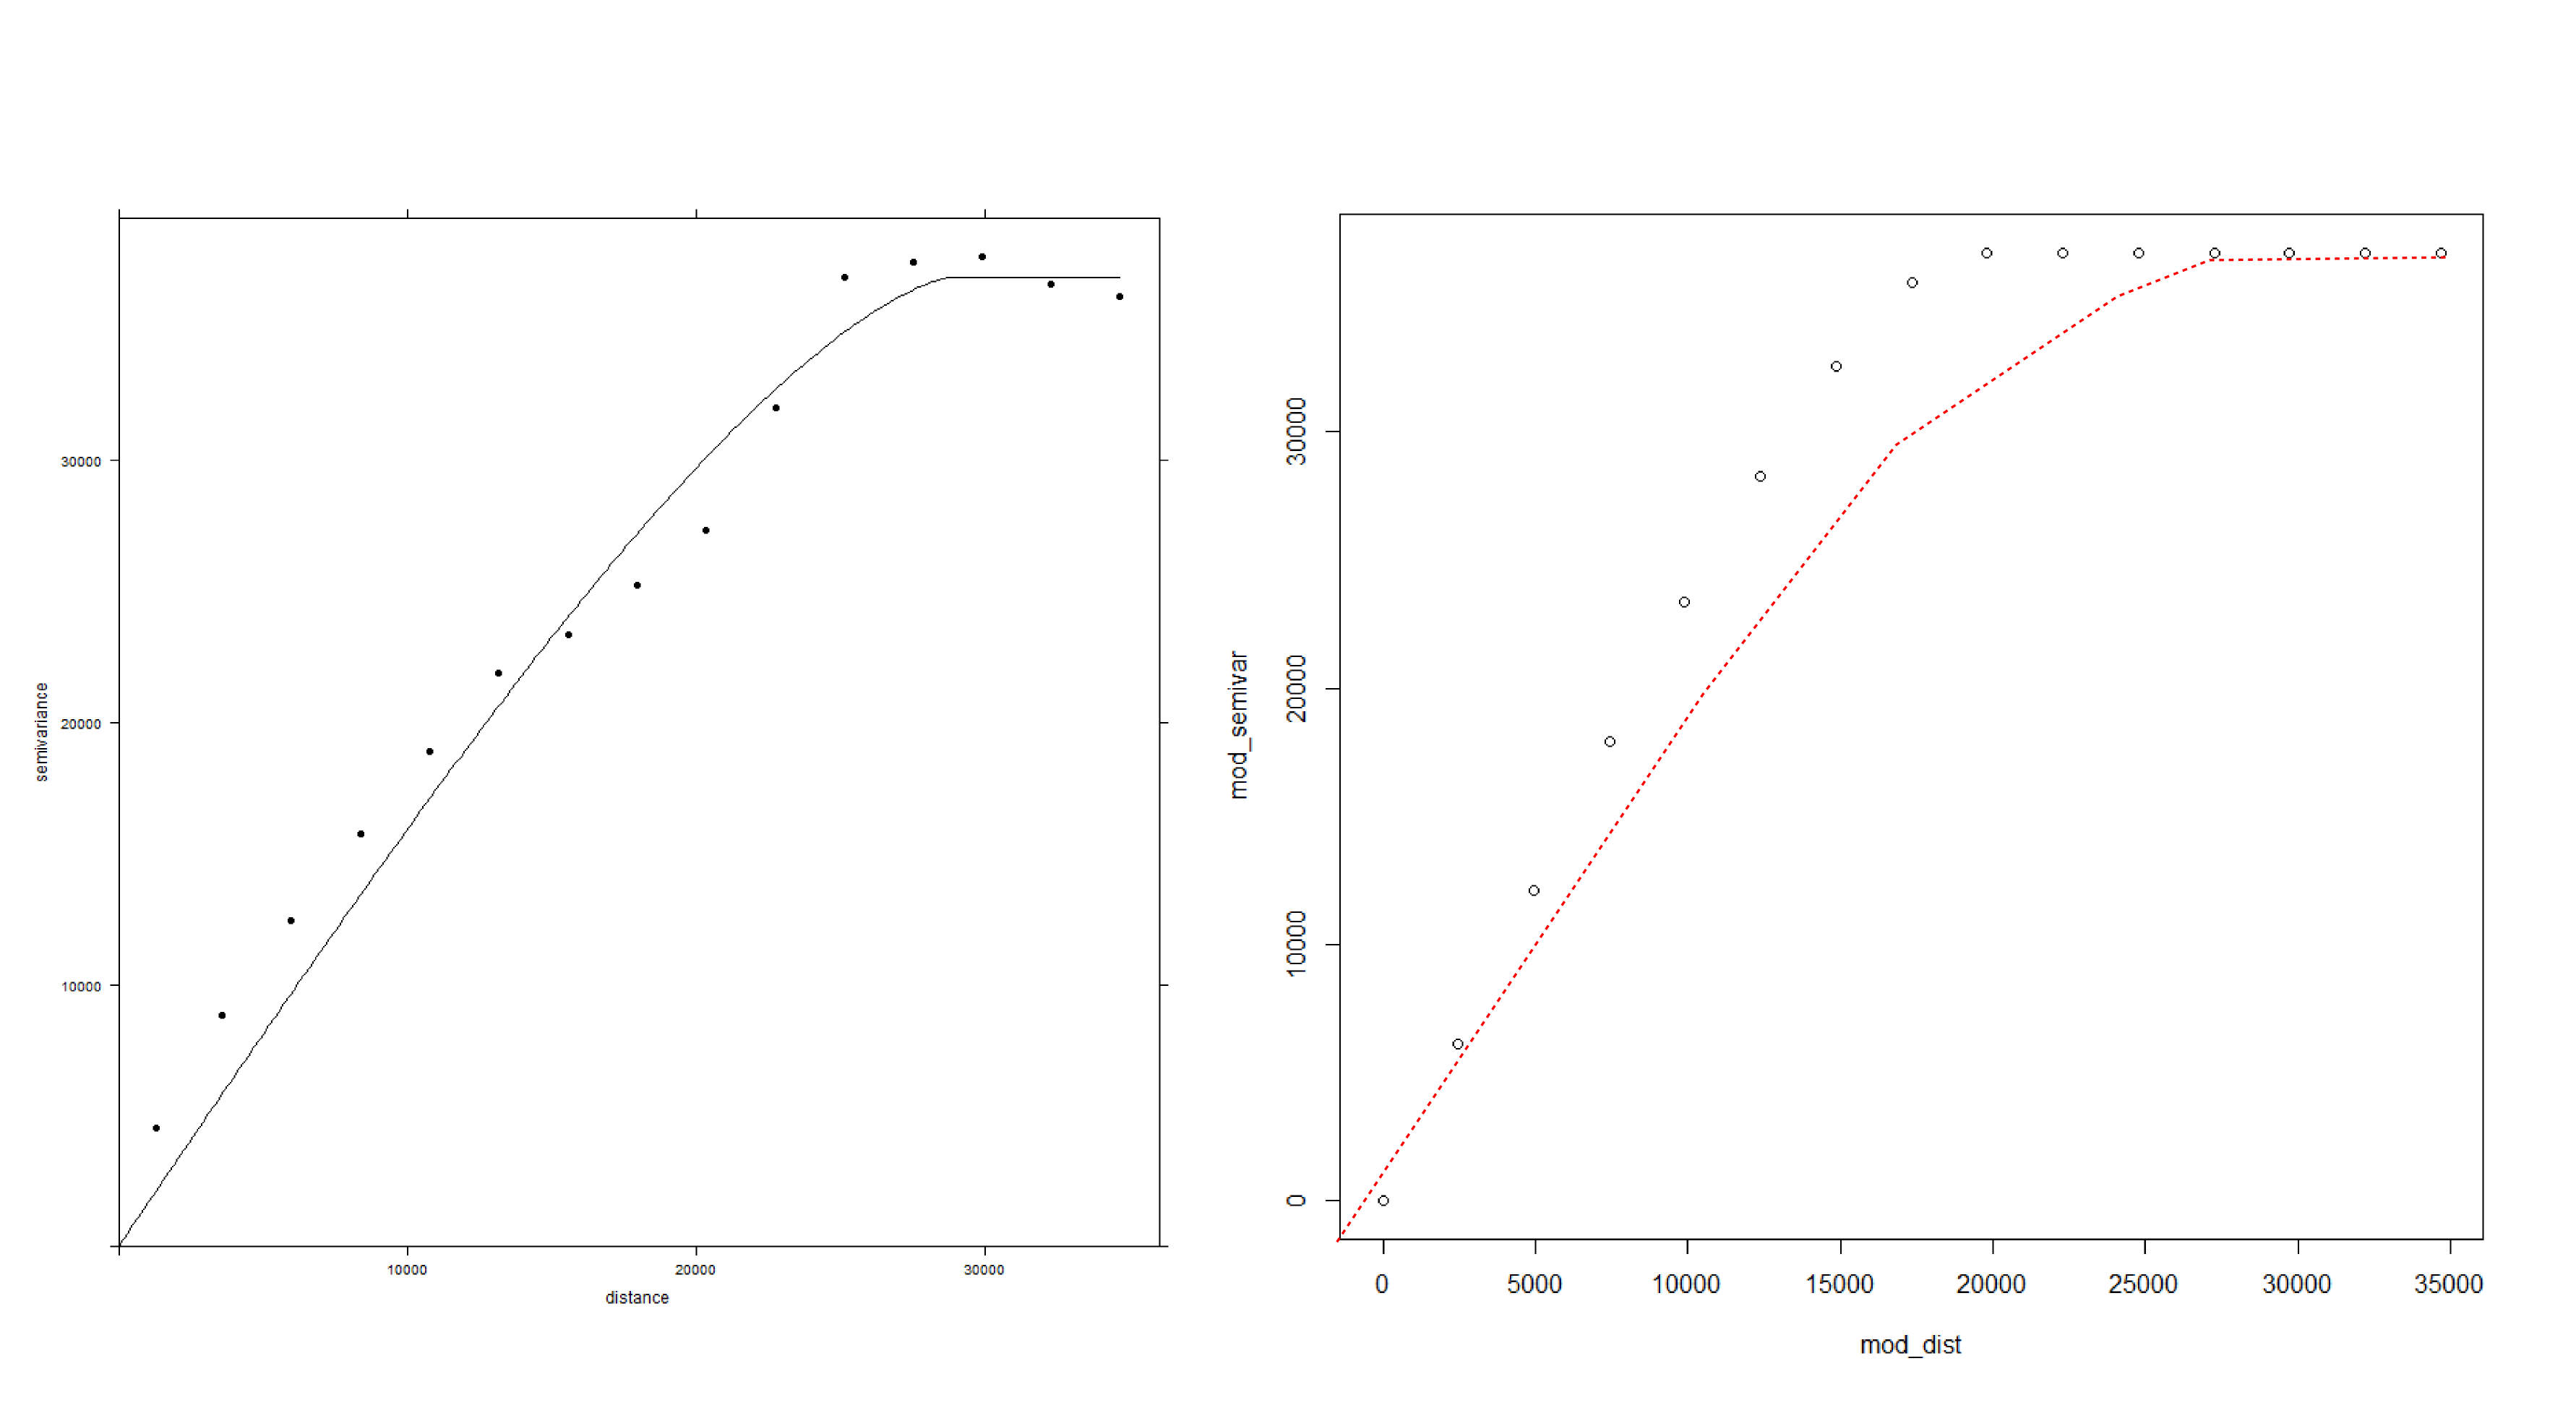
I am trying to extract the semivariance values associated with a given semivariogram model developed in gstat, the end goal being to compare modelled semivariance with observed semivariance at defined distances. Using the function variogramLine to get semivariance values from my semivariogram model, I find that the values don't match the model when plotted over the semivariogram itself.
A sample of the data is available here: https://www.dropbox.com/sh/mjqhika3stqjv6m/AAAIN_89Hpaiye0G7f_J-Hy_a?dl=0. My code is as follows:
library(raster)
library(sp)
library(gstat)
library(DiceEval)

## Read in sample data
sample_region_sub=read.csv('sample_region_sub_zeroed.csv')
coordinates(sample_region_sub) = ~x+y
xx=coordinates(sample_region_sub)[,1]
yy=coordinates(sample_region_sub)[,2]

## Create anisotropic variogram
anisotropy_major=60
anisotropy_minor=0.4
aniso <- variogram(z_fixed~1,data=sample_region_sub, alpha=anisotropy_major, tol.hor=15)

## Define variogram model
model="Cir"
nugget=0.0
sill=37000
range=29000
lzn.vgm.aniso.fit = vgm(sill, model, range, nugget=nugget, anis = c(anisotropy_major, anisotropy_minor))

## Extract binned observed distances and associated semivariance from the variogram
observation.dist <- aniso[1:15,2]
observation.semivar <- aniso[1:15,3]

## Get semivariance values from the semivariogram model at distances matching binned observatioons
model_vals<-variogramLine(lzn.vgm.aniso.fit, max(observation.dist), min=0.0000000001, dist_vector=observation.dist, n=15)
model.dist<-model_vals[1:15,1]
model.semivar<-model_vals[1:15,2]

# Calculate RMSE between modelled and observed semivariances
rmse_val<-RMSE(observation.semivar,model.semivar)
print(paste0("RMSE value: ", rmse_val))

#Plot the variogram with model
plot(aniso, lzn.vgm.aniso.fit, pch=16,col=1)

#Plot the variogram model based on the values derived using the variogramLine function
plot(model.dist,model.semivar)
The model over the semivariogram is displayed below on the left and the the model values as derived from the variogramLine function are displayed below on the right - an approximation of the more expected line of values are indicated by the dashed red line:
I don't expect the semivariance values of the model to reach the sill (of 37000) until a distance of 29000 -- this appears to be the case when plotting the model over the variogram.
For some reason, the variogramLine function is resulting in the sill starting too early with semivariance values of 37000 starting at a distance of 20358.748.
> model.dist

[1]  1318.144  3594.049  5984.156  8385.170 10782.903 13180.323 15575.042 7960.348 20358.748 22762.688 25142.530
[12] 27530.787 29927.075 32300.067 34694.453

> model.semivar

[1]  3253.653  8825.639 14536.511 20025.830 25140.613 29739.826 33612.338 36381.816 37000.000 37000.000 37000.000
[12] 37000.000 37000.000 37000.000 37000.000
Can anyone please tell me why I'm not getting the variogram model semivariance values that I can see when plotting my model over my semivariogram? I can't figure out why they are different.

