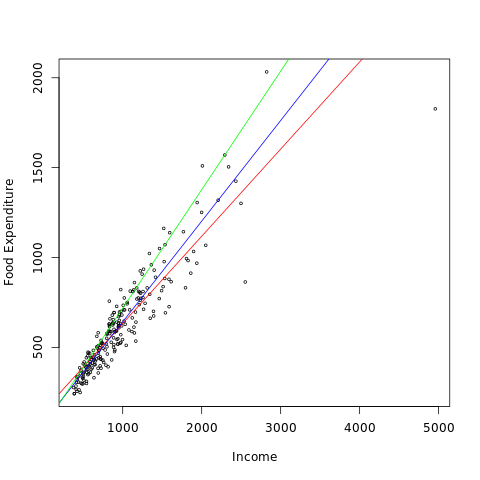
I hope somebody can help me with a, probably very fundamental, issue of understanding concerning quantile regression.
My dataset is very skewed, so I've looking at the data with quantile regression because of all the literature claiming that this allows us to make inferrences about the marginal parts of the distribution. However, when we're dealing with a specific quantile, isn't the usual way of frameing this quantile as 'quantile x contains all values below y'.
So, if I perform quantile regression in for all the centiles (0.1,0.2,...,0.9). And I e.g. look at the results for quantile 0.8. Am I then looking at regression coefficients calculated for all members of the dataset below the 0.8 quantile value? Or exactly 'how far back' do the regression include data points?
Attempting to illustrate with graphics...when I look at regression coefficients for the 0.8 quantile, how much of my data is included in the calculation of these results? The entire distribution up until 0.8, or just the members between the current and the previous QR regression point (0.7)


