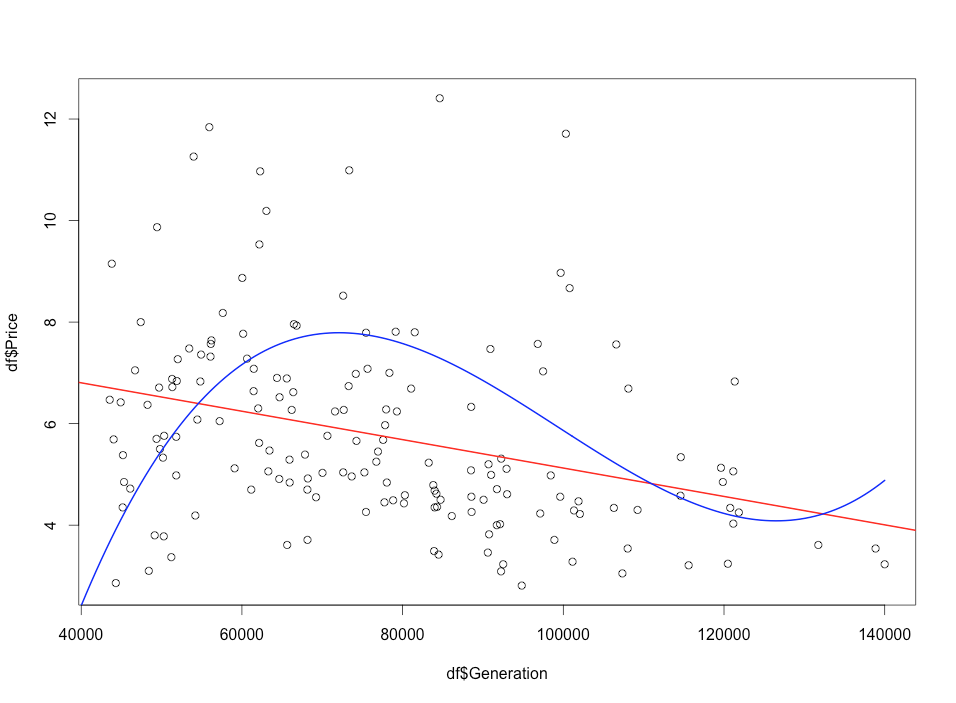
I'm new to R and linear regression but would like to fit a model to the following data set to investigate the trend between the X (generation) and Y (price) variables.
I tried a straight line linear regression using lm shown in red, and also with a linear spline regression using bs from the splines package, but both does not appear to be a decent fit.
Also tried transforming the Y variable and/or the X variable using log but that does not seem to make the data more linear.
Any suggestions on how to proceed?
# Fit with straight line
fit <- lm(df$Price ~ df$Generation)
plot(df$Generation, df$Price)
abline(fit, col='red', lwd=2)

# Fit with splines
x <- seq(40000, 140000, length.out=length(df$Price))
fit2 <- lm(df$Price ~ bs(x,3))
lines(x, fit2$fitted.values, col='blue', lwd=2)
Here is the dataframe:
"Date","Price","Generation"
"1","Jan-2002",3.1,48413
"2","Feb-2002",2.86,44308
"3","Mar-2002",3.37,51214
"4","Apr-2002",3.8,49146
"5","May-2002",3.78,50275
"6","Jun-2002",3.61,65631
"7","Jul-2002",3.49,83917
"8","Aug-2002",3.42,84477
"9","Sep-2002",3.71,68161
"10","Oct-2002",4.19,54201
"11","Nov-2002",4.35,45161
"12","Dec-2002",4.72,46100
"13","Jan-2003",5.33,50176
"14","Feb-2003",6.47,43547
"15","Mar-2003",7.05,46699
"16","Apr-2003",5.38,45195
"17","May-2003",5.7,49373
"18","Jun-2003",6.08,54453
"19","Jul-2003",5.45,76938
"20","Aug-2003",5.23,83250
"21","Sep-2003",5.12,59090
"22","Oct-2003",4.98,51824
"23","Nov-2003",4.85,45328
"24","Dec-2003",5.69,44035
"25","Jan-2004",6.37,48253
"26","Feb-2004",5.76,50320
"27","Mar-2004",5.5,49801
"28","Apr-2004",5.74,51822
"29","May-2004",6.3,62022
"30","Jun-2004",6.52,64686
"31","Jul-2004",6.24,79290
"32","Aug-2004",5.97,77821
"33","Sep-2004",5.39,67854
"34","Oct-2004",6.05,57229
"35","Nov-2004",6.71,49693
"36","Dec-2004",6.88,51310
"37","Jan-2005",6.72,51338
"38","Feb-2005",6.42,44913
"39","Mar-2005",6.84,51897
"40","Apr-2005",7.27,52016
"41","May-2005",6.83,54826
"42","Jun-2005",7.08,75635
"43","Jul-2005",7.57,96819
"44","Aug-2005",8.67,100787
"45","Sep-2005",10.99,73355
"46","Oct-2005",11.84,55941
"47","Nov-2005",9.87,49440
"48","Dec-2005",11.26,53993
"49","Jan-2006",9.15,43807
"50","Feb-2006",8,47409
"51","Mar-2006",7.36,54922
"52","Apr-2006",7.32,56091
"53","May-2006",6.89,65586
"54","Jun-2006",6.69,81060
"55","Jul-2006",6.69,108094
"56","Aug-2006",7.56,106592
"57","Sep-2006",6.27,72673
"58","Oct-2006",5.76,70640
"59","Nov-2006",7.48,53440
"60","Dec-2006",7.57,56128
"61","Jan-2007",7.08,61475
"62","Feb-2007",8.18,57622
"63","Mar-2007",7.64,56204
"64","Apr-2007",7.77,60153
"65","May-2007",7.96,66470
"66","Jun-2007",7.8,81511
"67","Jul-2007",7.03,97483
"68","Aug-2007",6.83,121338
"69","Sep-2007",6.33,88532
"70","Oct-2007",7,78358
"71","Nov-2007",7.28,60637
"72","Dec-2007",7.93,66808
"73","Jan-2008",8.52,72600
"74","Feb-2008",8.87,60042
"75","Mar-2008",9.53,62171
"76","Apr-2008",10.19,63046
"77","May-2008",10.97,62270
"78","Jun-2008",12.41,84620
"79","Jul-2008",11.71,100321
"80","Aug-2008",8.97,99673
"81","Sep-2008",7.81,79136
"82","Oct-2008",6.74,73283
"83","Nov-2008",6.64,61454
"84","Dec-2008",6.9,64364
"85","Jan-2009",6.62,66390
"86","Feb-2009",5.62,62139
"87","Mar-2009",4.92,68203
"88","Apr-2009",4.7,61159
"89","May-2009",4.7,68146
"90","Jun-2009",4.62,84205
"91","Jul-2009",4.47,101894
"92","Aug-2009",4.3,109240
"93","Sep-2009",4.02,92127
"94","Oct-2009",5.04,72603
"95","Nov-2009",5.06,63285
"96","Dec-2009",6.24,71590
"97","Jan-2010",6.98,74173
"98","Feb-2010",6.27,66198
"99","Mar-2010",5.47,63431
"100","Apr-2010",4.91,64644
"101","May-2010",4.96,73665
"102","Jun-2010",5.31,92268
"103","Jul-2010",5.34,114624
"104","Aug-2010",5.06,121151
"105","Sep-2010",4.61,93004
"106","Oct-2010",4.45,77738
"107","Nov-2010",4.55,69227
"108","Dec-2010",5.68,77573
"109","Jan-2011",5.66,74254
"110","Feb-2011",5.29,65924
"111","Mar-2011",4.84,65947
"112","Apr-2011",5.03,70029
"113","May-2011",5.04,75243
"114","Jun-2011",5.2,90691
"115","Jul-2011",5.13,119624
"116","Aug-2011",4.85,119856
"117","Sep-2011",4.71,91739
"118","Oct-2011",4.49,78819
"119","Nov-2011",4.26,75441
"120","Dec-2011",4.18,86122
"121","Jan-2012",3.82,90761
"122","Feb-2012",3.46,90610
"123","Mar-2012",3.09,92251
"124","Apr-2012",2.81,94829
"125","May-2012",3.05,107352
"126","Jun-2012",3.21,115598
"127","Jul-2012",3.54,138863
"128","Aug-2012",3.61,131736
"129","Sep-2012",3.54,108012
"130","Oct-2012",4,91725
"131","Nov-2012",4.43,80169
"132","Dec-2012",4.35,83989
"133","Jan-2013",4.56,88559
"134","Feb-2013",4.59,80283
"135","Mar-2013",4.5,84725
"136","Apr-2013",4.84,78036
"137","May-2013",4.79,83816
"138","Jun-2013",4.56,99615
"139","Jul-2013",4.34,120771
"140","Aug-2013",4.03,121156
"141","Sep-2013",4.22,102063
"142","Oct-2013",4.26,88587
"143","Nov-2013",4.36,84287
"144","Dec-2013",5.11,92936
"145","Jan-2014",7.47,90926
"146","Feb-2014",7.79,75449
"147","Mar-2014",6.28,77950
"148","Apr-2014",5.25,76728
"149","May-2014",5.08,88514
"150","Jun-2014",4.98,98441
"151","Jul-2014",4.58,114582
"152","Aug-2014",4.25,121849
"153","Sep-2014",4.34,106295
"154","Oct-2014",4.23,97125
"155","Nov-2014",4.68,83990
"156","Dec-2014",4.5,90077
"157","Jan-2015",4.29,101330
"158","Feb-2015",4.99,91013
"159","Mar-2015",3.71,98889
"160","Apr-2015",3.23,92516
"161","May-2015",3.28,101148
"162","Jun-2015",3.24,120481
"163","Jul-2015",3.23,139997


bsby default fits cubic splines, not linear ones. If you do want linear splines, you need to setdegree=1in its arguments $\endgroup$