9
$\begingroup$

I am trying to use Random Forest regression. I have a response variable:

y = rnorm(10000, mean=0, sd=3)

And a few predictor variables (which are just the response with added noise):

x = data.frame(v1=y + rnorm(10000, mean=0, sd=3), v2=y + rnorm(10000, mean=0, sd=3), v3=y + rnorm(10000, mean=0, sd=3))

I build the random forest:

r = randomForest(x, y)

The model is good, explaining ~73% of the variance. However, when I look at the residuals:

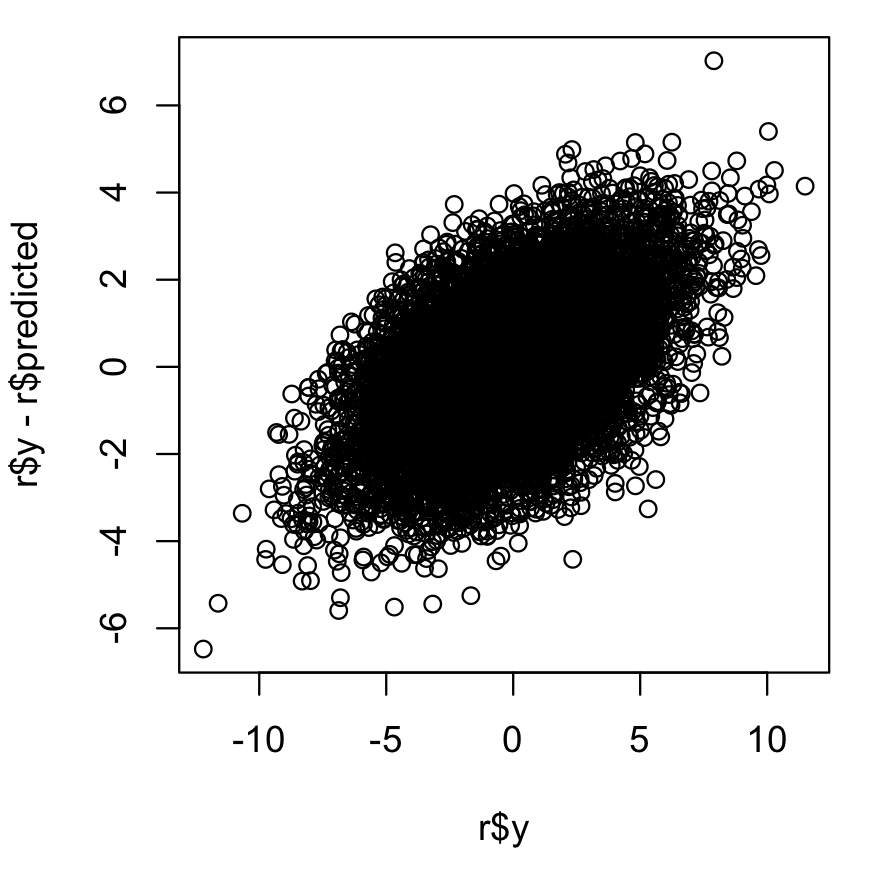
plot(y, y - r$predicted)

Instead of being centered around zero, the residuals are correlated with the response variable

Instead of being centered around zero, they are correlated with the response variable. It seems that the model should correct this. Maybe, since each OOB prediction is an average, this behavior is some kind of "regression to the mean"? Does anyone know why this happens? Is anything I can do about it?

I am trying to build a model and use the residuals to estimate something. Right now, they are useless because they only reflect the value I'm trying to predict. If anyone can help, I'd really appreciate it!

$\endgroup$
3
  • $\begingroup$ "skewed" has a particular meaning in statistics. It might be better to make the title something like "Random forest regression - residuals correlated with response". I'll make that change but if you want it to say something different you can always edit again. $\endgroup$
    – Glen_b
    Commented Nov 7, 2015 at 1:27
  • $\begingroup$ I think Residual plots are plotted for fitted values(x) vs residuals(y-yhat). $\endgroup$ Commented Feb 6, 2017 at 9:56
  • $\begingroup$ You want to plot the model residuals on the y as a function of the predicted values of the model on the x. There should be no correlation here and if there is, you violate the assumption of homoscedasticity in OLS. $\endgroup$
    – colin
    Commented Jan 14, 2020 at 19:00

1 Answer 1

9
$\begingroup$

This is exactly what you should expect to see.

You see exactly the same thing with an ordinary regression model; if the model has $R^2$ higher than 0, residuals are correlated with the response. It's the fitted values that the residuals are uncorrelated with.

Specifically, each regression captures all of the variation in $y$ that's explained by the predictors. Doing that means that $\hat{y}$ is uncorrelated with the residual -- because if it were not uncorrelated, there would be uncaptured variation that the $x$'s could capture. As a result of capturing everything that the $x$'s can capture in the regression model, there must be a correlation of residuals with the actual $y$ values:

$\text{Cov}(y,y-\hat{y}) = \text{Cov}(y-\hat{y},y-\hat{y})+ \text{Cov}(\hat{y},y-\hat{y})= \text{Var}(y-\hat{y})+0=\sigma^2$

-- since that covariance is positive, the correlation will be.

Regularization changes things somewhat but the same correlation appears.

[The component of $y$ that's uncaptured by the model, even if it's just pure noise, is obviously correlated with itself. That's really all we're seeing here]

Such a correlation will be present in every one of the regressions, and so correlation will carry over to the random forest as a whole.

There's nothing to fix here, it's actually supposed to do that. You see it even if you fit exactly the model that generated your data.

 x = rbeta(1000,1.8,1.8)*20+5     # make some x variable
 y = 0.8+0.3*x+rnorm(1000,0,1.5)  # simulate a regression model
 lmfit = lm(y~x)                  # fit the true regression model
 plot(y,lmfit$residual)           # voila!                             $
 cor(y,lmfit$residual)

$\qquad$ enter image description here
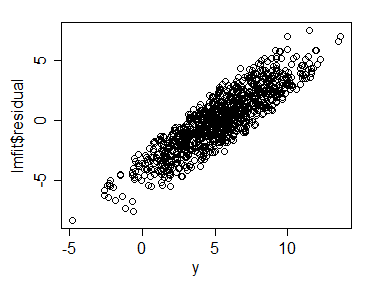
You'll see a correlation in the vicinity of 70% for this example.

In fact if you increase the variance of the noise term (other things being equal), the correlation is stronger. Try the above with more noise:

 y = 0.8+0.3*x+rnorm(1000,0,2.5)  # simulate a regression model

and see what happens!

It may be that you will want to ask another question explaining the original problem you were trying to solve, because your choice of how to go about it may not have been ideal (it's hard to tell from what is here).

$\endgroup$

Your Answer

By clicking “Post Your Answer”, you agree to our terms of service and acknowledge you have read our privacy policy.

Not the answer you're looking for? Browse other questions tagged or ask your own question.