10
$\begingroup$

What is the interpretation of the number that is the output of the logistic regression function?

The logistic function

$$f(\vec{x}) = \frac{1}{1+e^{-g(\vec{x})}}$$

(where $g$ is a linear function) is supposed to map a continuous variable (or more generally a whole bunch of totally ordered variables) to between 0 and 1.

I've always assumed it is the probability of inclusion in one set or the other. The range is $[0,1]$ (well, maybe not 0 and 1), which is what a probability is. And frankly anything between 0 and 1, what else could it be other than a probability.

But looking at the curve, I started to doubt. I wondered if it is necessarily to be interpreted as a probability. It looks like a probability but is it really? Just because they share the same range doesn't mean they are the same. If $f(\vec{x}) = .75$, does that really mean that $75\%$ of $f$ is less than $f(\vec{x})$?

This could go in two directions:

  • Suppose it is a probability, or more exactly the probability of a 'true', '1', or 'positive' classification of a point in the domain. How is this justified?

  • Suppose not. Then what is it exactly and why? How far a way is it from a probability (numerically and conceptually)?

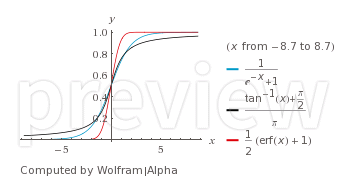
Another way to say this is what is so special about $1/(1+e^{-g(x)})$? Why not any monotonically increasing odd (about $y=1/2$) function with the same range, like $$f(x) = \frac{\tan^{-1}(g(x))+\pi/2}{\pi}$$ or $$f(x) = {\rm erf}(g(x)) = \frac{2}{\sqrt{\pi}} \int_{-\infty}^x e^{-t^2} \ {\rm d}t$$ (very close but not equal to the logistic function)

3 sigmoid-like functions

or frankly $$f(x) = \begin{array}{ll} 0,& {\rm if\ } g(x) < 0\\ 1,& {\rm if\ } g(x) >= 0 \end{array}$$ ?

$\endgroup$
6
  • 3
    $\begingroup$ Logistic regression is supposed to fit the conditional probability $p(Y=1|{\bf X}=\vec{x})$, but of course, it is possible the model is misspecified. $\endgroup$ Commented Dec 3, 2015 at 21:01
  • 2
    $\begingroup$ @gung but what are the grounds of such assumption? Just the fact that sigmoid value lies between zero and 1? $\endgroup$
    – Yurii
    Commented Dec 3, 2015 at 21:29
  • $\begingroup$ @Yurii, what assumption? If the relationship is curvilinear, but you don't include a curvilinear term, the fitted probabilities would differ from the true probabilities. $\endgroup$ Commented Dec 3, 2015 at 21:35
  • $\begingroup$ @gung the assumption is that logistic regression is going to produce conditional probability you mentioned $\endgroup$
    – Yurii
    Commented Dec 3, 2015 at 21:39
  • $\begingroup$ See also stats.stackexchange.com/questions/163034/… $\endgroup$
    – Tim
    Commented Dec 4, 2015 at 15:46

1 Answer 1

4
$\begingroup$

What is the interpretation of the number that is the output of the logistic regression function?

Logistic regression as understood in recent decades is explicitly used as a model for Bernoulli or binomial data (with extensions into other cases such as multinomial), where the model if for the parameter, $p$, which is indeed a probability.

However, logistic regression has its origins in modelling the growth of a proportion over time[1] (which may be continuous), so in origins it bears a close link to nonlinear models that fit logistic growth curves

And frankly anything between 0 and 1, what else could it be other than a probability.

Well, something between 0 and 1 could be a model a continuous fraction such as the proportion of substance A in a mix of things. Can logistic regression model such a thing? The model for the mean makes sense, but the model for the variance doesn't necessarily make sense; in logistic regression the variance function is of the form $\mu(1-\mu)$. This is directly related to the variance of a Bernoulli.

However (for example) one could consider approximating something like a beta (which has variance function proportional to $\mu(1-\mu)$) by a quasi-binomial model; then we wouldn't necessarily be modelling a probability as such, but we'd still arguably be using logistic regression to do it.

So while it's nearly always conceived as a model for a probability, it doesn't necessarily have to be.

Suppose it is a probability, or more exactly the probability of a 'true', '1', or 'positive' classification of a point in the domain. How is this justified?

I don't understand the question here. If it's explicitly a model for $p$ in a Bernoulli, what additional sort of justification do you seek? Of course the link function may be wrong (while that's no great difficulty - since other links could be used - we would no longer be doing logistic regression).

[1]: Cramer, J.S. (2002),
"The Origins of Logistic Regression,"
Tinbergen Institute, December
http://papers.tinbergen.nl/02119.pdf

$\endgroup$
3
  • 1
    $\begingroup$ I think what I'm trying to get at is why aren't other similarly shaped curves not measures of probability? Like $f(2x) = \frac{\tanh(x)+1}{2}$, or the CDF of the normal curve? $\endgroup$
    – Mitch
    Commented Dec 8, 2015 at 16:52
  • 1
    $\begingroup$ Using the CDF of a normal curve is explicitly not logistic regression, as it does not use a logistic function. Models using the normal CDF are called probit. Yet another kind of -obit model is the robit, which uses the Cauchy CDF. $\endgroup$
    – Sycorax
    Commented Dec 8, 2015 at 17:40
  • $\begingroup$ @Mitch They are! The probit link function is often used in place of the logit in Bernoulli(/binomial) glms, for example (and it's not the only one; many stats packages offer the complementary-log-log link function, which is another cdf). I'm pretty sure your edited question is now a duplicate though. $\endgroup$
    – Glen_b
    Commented Dec 8, 2015 at 22:26

Not the answer you're looking for? Browse other questions tagged or ask your own question.