I have a time-series of a feature(metric) for 4 different servers each of length 2000. I want to use dbscan algorithm to figure out if all 4 machines fall in the same cluster or not using dbcscan on these 4 time-series.
I am using the dbscan package in R and my input is a 4 x 2000 matrix(inputMatrix) to the dbscan function. To determine the parameters I am determining the value of k/minpts as follows.
Calculation of k: 1.) There are 2000 points and 4 rows. Considering one column at a time, I am calculating the distance of each point from the remaining three points and then taking the mean. So this gives me 4 avg distances corresponding to 4 servers/rows at a particular time. So I again have a 4 x 2000 matrix of distances(distMatrix).
distmat<-function(x){
#each column of distance is the distances of each server with other servers.
distance<-as.matrix(dist(x = x,method = "euclidean",diag=T,upper=T))
return(apply(X = distance,MARGIN = 1,FUN = mean))
}

distMatrix<-apply(X = inputMatrix,MARGIN = 2,FUN = distmat)
2.) With each point as a center in the inputMatrix and corresponding avg dist in distMatrix as radius I calculated the maximum number of points that lie in the neighbourhood.
numberofpoints<-matrix(data = rep(x = 0,8000),nrow = 4,ncol = 2000)
for(i in 1:ncol(inputMatrix)){
    for(j in 1:nrow(inputMatrix)){
        numberofpoints[j,i]=length(which(inputMatrix[,i]<=inputMatrix[j,i]+distMatrix[j,i] & inputMatrix[,i]>=inputMatrix[j,i]-distMatrix[j,i]))
    }
}
Again taking a mean over the column first and then over the row yields the value of k/minpts.
meannumberofpoints<-apply(X = numberofpoints,MARGIN = 2,FUN = mean)
k=mean(meannumberofpoints)
k for my data is 2.167125
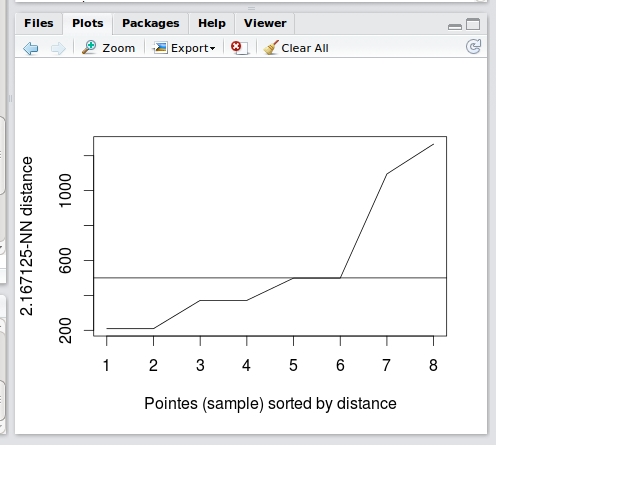
To find EPS: There is an inbuilt kNNdistplot function in dbscan package in R which plots the knee-like graph.
The horizontal line across the image corresponds to the eps value. However, I am not sure what variables it is plotting on the two axes. I want to automate this sorted k-graph calculation and plot it but I am not sure where to start.
Can anyone please explain what are the variables/values plotted on the x and y axis and how to calculate these. Thanks.

