0
$\begingroup$

I need to be able to find outliers in my data. I thought it best to test for this using the Kolmogorov-Smirnov Test.

I have over 800,000 points so I wanted a way to filter the data first to only test those that are on the edge of my sample. By eye I can fit an exponential decay (red line) but I was wondering if there was a statistical way to determine the parameters for my exponential.
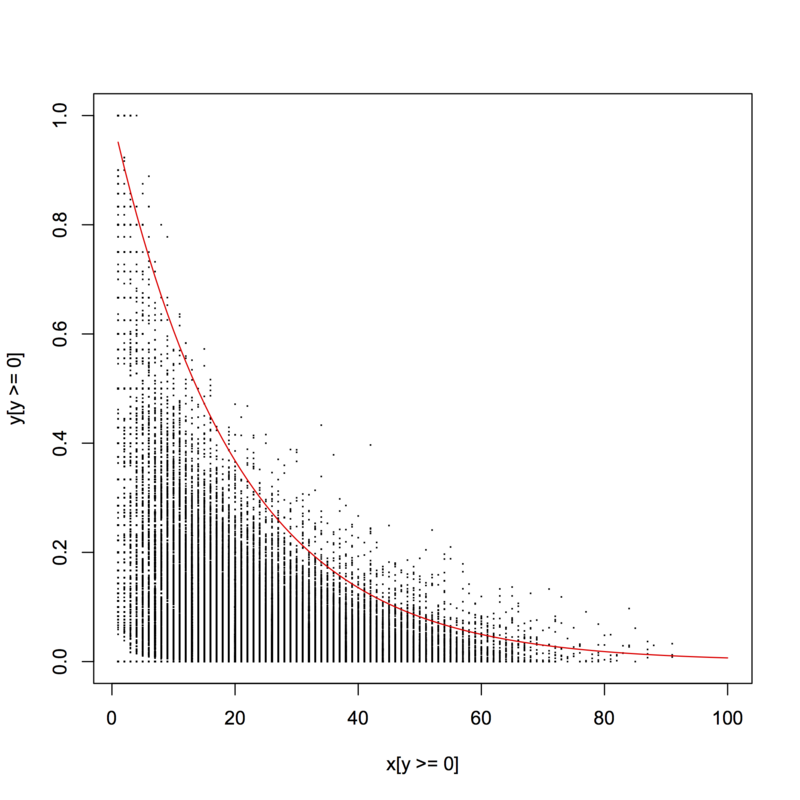
enter image description here

$\endgroup$
7
  • 3
    $\begingroup$ You will find it illuminating to plot these bivariate data on log-log axes. (To include the zero values you will need to add a small constant to all values first.) Among other things, you will find that the exponential decay is not quite right; the relationship may be better approximated with a power law. $\endgroup$
    – whuber
    Commented Dec 16, 2011 at 15:14
  • $\begingroup$ +1 whuber. @xboxrob: Aren't you, by fitting a curve, already making assumptions about what might be an outlier? I'm not sure. $\endgroup$
    – Wayne
    Commented Dec 16, 2011 at 16:12
  • 4
    $\begingroup$ Might help if you say why you need to find outliers. By eye, I wouldn't say there are any particularly severe outliers, considering the size of the data set. The only obvious anomaly is the little line of values with y=0 for x=1,2,3,4.. with a gap just above it. $\endgroup$
    – onestop
    Commented Dec 16, 2011 at 16:21
  • 2
    $\begingroup$ xboxrob, it is unclear what you are asking for, and consequently the replies you are getting may or may not be applicable; at any rate, future readers will not be able to gauge whether they are appropriate solutions. The K-S test does not seem applicable--you display bivariate data and it's for univariate data only--and finding outliers does not seem related to your red curve. What exactly do you want to accomplish? $\endgroup$
    – whuber
    Commented Dec 19, 2011 at 2:05
  • 2
    $\begingroup$ On the contrary, I noted these are bivariate data, as your description confirms. It is really strange that the variance of the measurements would increase as the measurements themselves decrease. This suggests that both $x$ and $y$ are actually differences relative to a large value (perhaps around $100$ or so). It would be more productive and informative to work with the original $(x,y)$ data. $\endgroup$
    – whuber
    Commented Jan 18, 2012 at 0:45

2 Answers 2

1
$\begingroup$

Perhabs nonlinear Quantile Regression?

$\endgroup$
0
$\begingroup$

My suggestion is to look for "extreme value" theory and distributions.

If you are using R do the following:

install.packages("texmex", dep=T)

then type following in the

help(package=texmex)

A

$\endgroup$

Your Answer

By clicking “Post Your Answer”, you agree to our terms of service and acknowledge you have read our privacy policy.

Not the answer you're looking for? Browse other questions tagged or ask your own question.