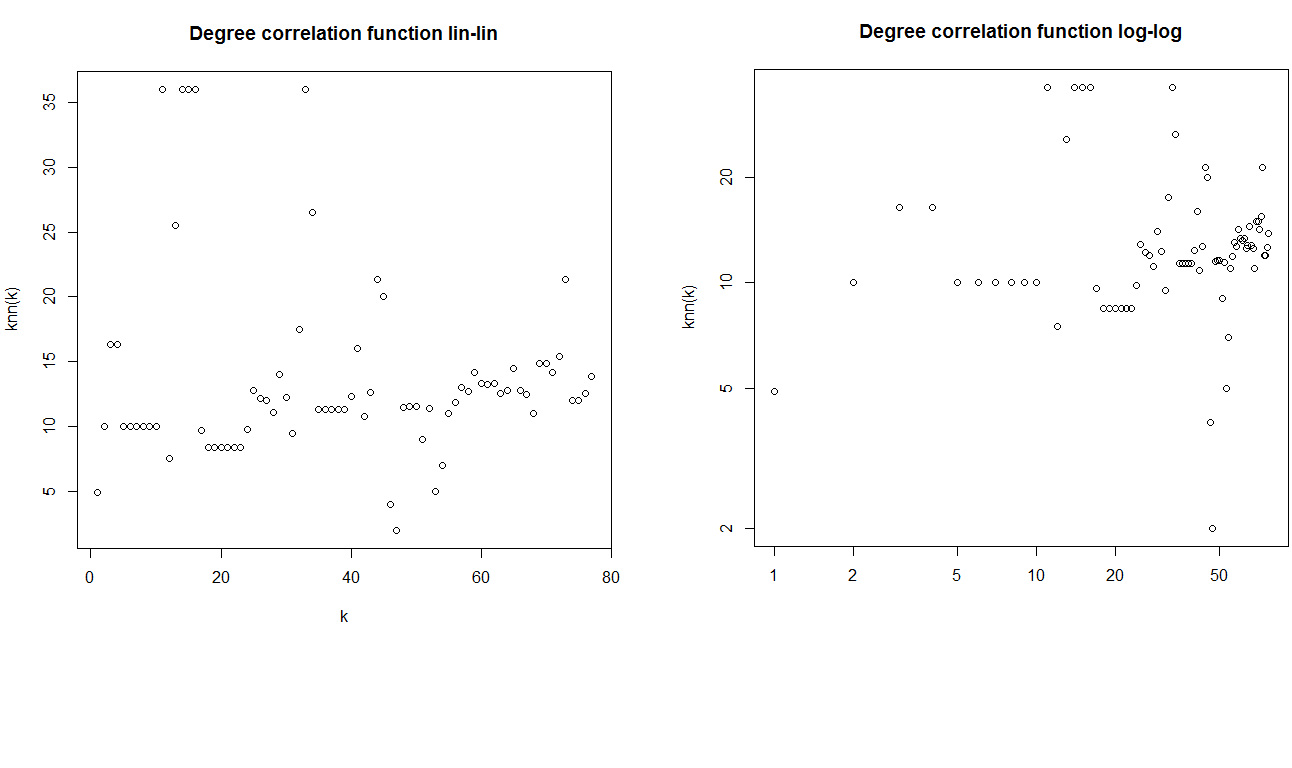
I'm trying to analyze the degree correlation of a given network and I can't understand what is the best way to do it.
With degree correlation I mean to find if the network is assortative (hubs connect to other hubs), disassortative (hubs connect to nodes with small degree) or neutral (links are random).
I tried these three ways:
(1) I opened the network in Gephi and it seems to me that nodes with high degree connect with other hubs, but this thing is not so clear as to say with certainty that the network is assortative.
(2) I tried the assortativity functions in R in this way:
net <- read.graph("./lesmiserables.gml", format = c("gml"))

assordegree <- assortativity.degree(graph = net, directed = FALSE)
print(assordegree)
[1] -0.1652251

assor <- assortativity(graph = net, types1 = graph.strength(net), directed = FALSE)
print(assor)
[1] -0.1652251
So I thought that the network was disassortative, as opposed to what I saw with Gephi.
(3) I then decided to try the knn function.
knnnet <- knn(graph = net)

plot(knnnet$knn, xlab = "k", ylab = "knn(k)", main = "Degree correlation function lin-lin")

plot(knnnet$knn, xlab = "k", ylab = "knn(k)", log = "xy", main = "Degree correlation function log-log")
From the log-log graph it seems that the network is assortative because knn(k) increases with k but the reasoning does not convince me.
Where am I doing wrong? Is there an easier or so that makes it more evident if the network is assortative or disassortative?

