Be careful when using correlation, it should be applied on stationary variables, otherwise you will measure spurious correlation. I can give you a detailed answer tomorrow if you don't mind, time to sleep now after a rough day at work... But basically, I suggest to use the idea of bootstrapping, i.e. you perturb your observations by sampling from them with replacement.
You create $L$ of such perturbed dataset (somewhat similar copies) and then you apply your clustering for $K=2..N-1$ and evaluate for each $K$ how similar are the results (with an Adjusted Rand Index for example). The rationale is that if there were some real underlying clustering structure of correlation, it should be persistent to small statistical noise. Thus, the better score for the real number of clusters $K$. I use that in practice on stocks and other financial products. It works quite well for detecting the macro level.
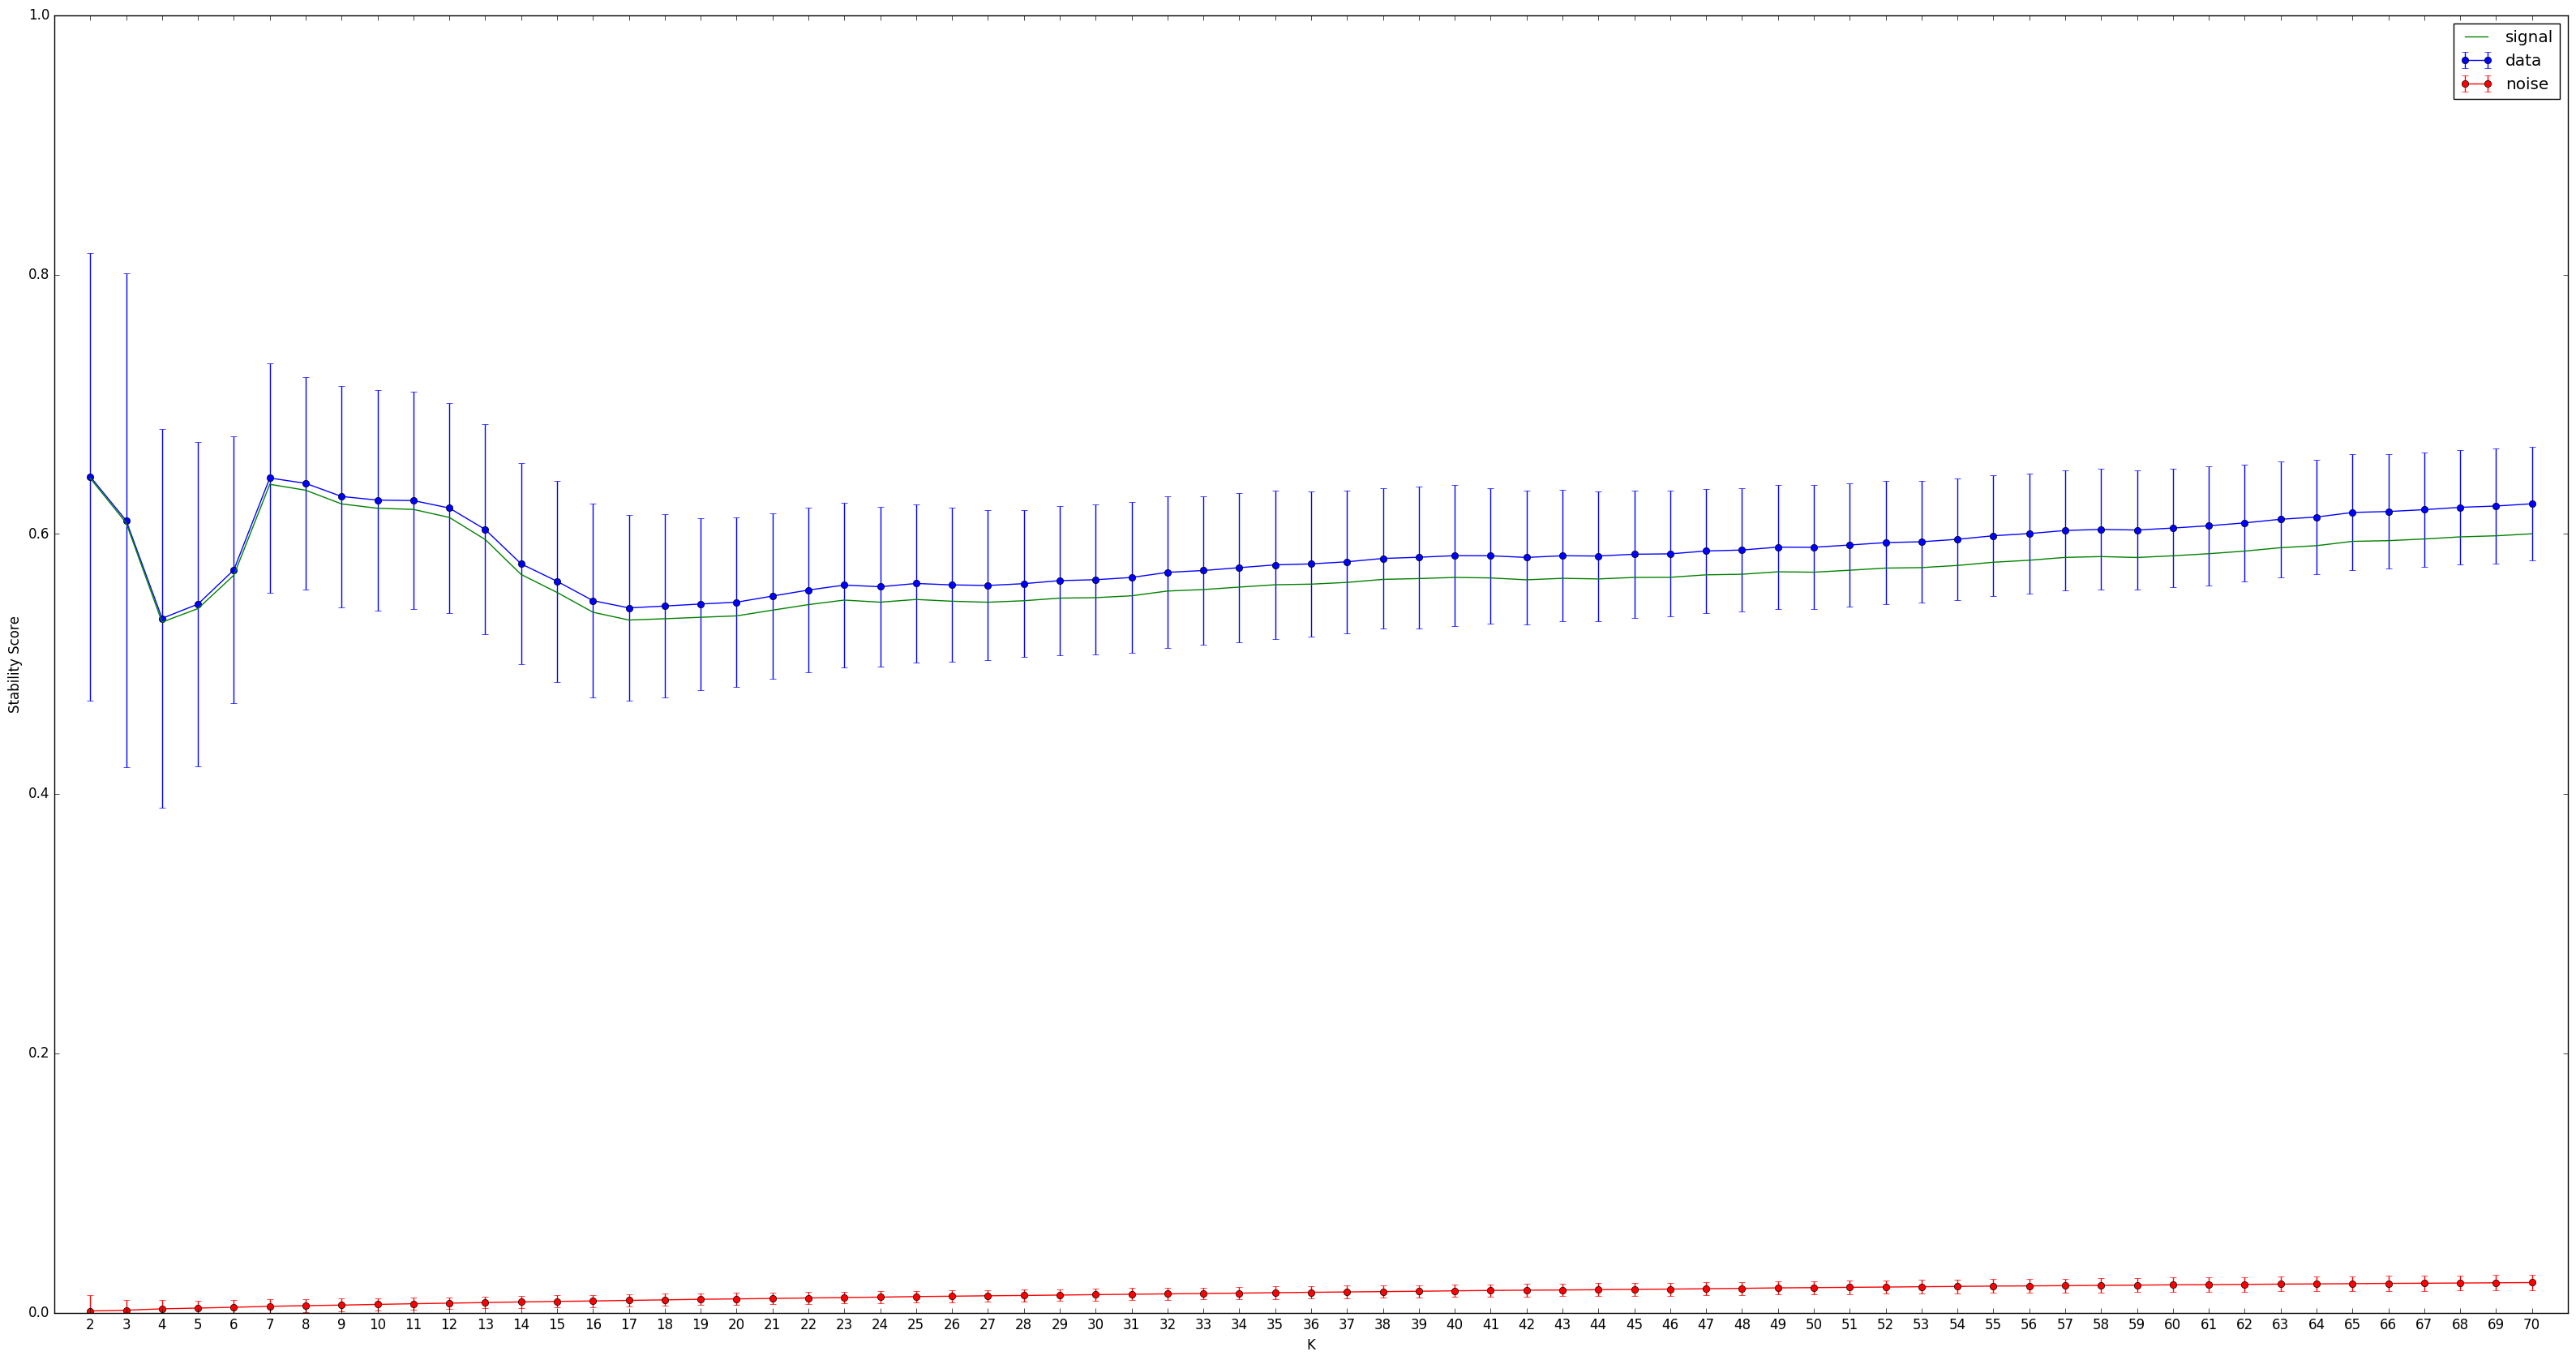
For example, you can use something similar to the code below. I also evaluate the stability on the pure noise samples to check for bias in the evaluation. Then, you can plot the stability scores and the noise scores, and have an idea of the number of clusters you may have in your data.
#load data
data,names,dates = read_data()

#create the bootstrap samples
obj_samples = create_bootsamples(data,names)

#create the noise samples
noise_samples = create_noise_samples(len(data),len(data[0]))

nbClust_min = 2
nbClust_max = round(len(names)/3)
nb_clusters = [i for i in range(nbClust_min,nbClust_max+1)]

stability_scores = []; noise_scores = []
for K in nb_clusters:
    print("nbCluster: "+str(K)+" / "+str(nbClust_max))
    for cur_sample in obj_samples:
        cur_sample["K"] = K
    for cur_noise in noise_samples:
        cur_noise["K"] = K
    #data processing
    boot_labels = Parallel(n_jobs=-2,verbose=5) (delayed(compute_clustering)(cur_sample) for cur_sample in obj_samples)
    stability_scores.append(evaluate_stability(boot_labels))
    #noise processing
    noise_labels = Parallel(n_jobs=-2,verbose=5) (delayed(compute_clustering)(cur_noise) for cur_noise in noise_samples)
    noise_scores.append(evaluate_stability(noise_labels))
And, I will get:
 which indicates me that there is a first level with 2 clusters, then 7 clusters, then it is approximately the same whatever the number of clusters. This makes sense knowning the data on which it was computing on :)
Nonetheless, be careful clustering may be quite slow to converge and it depends on
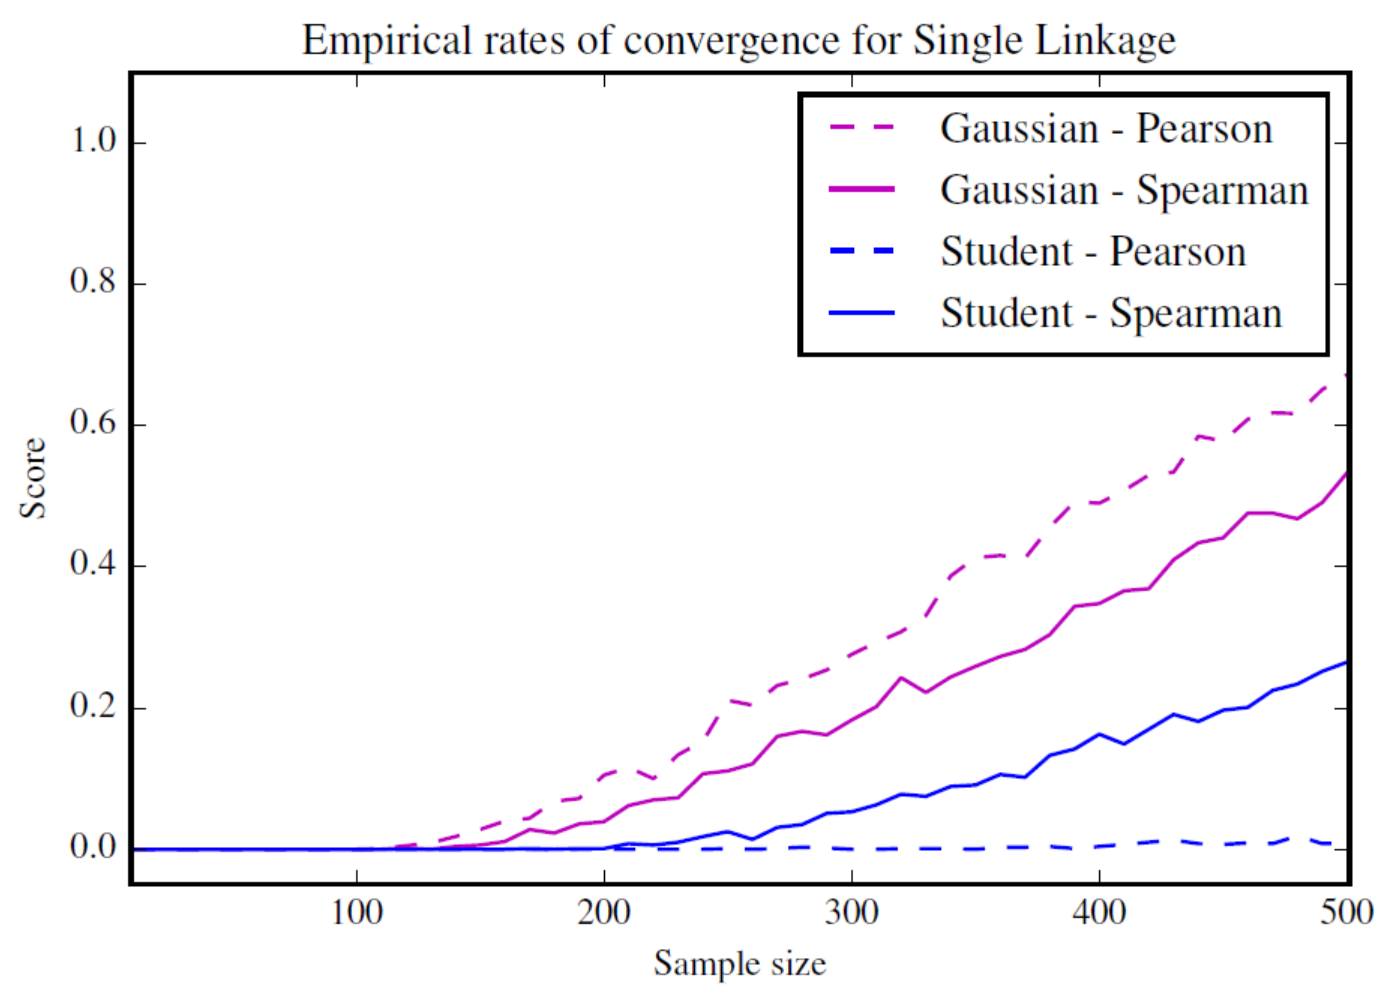
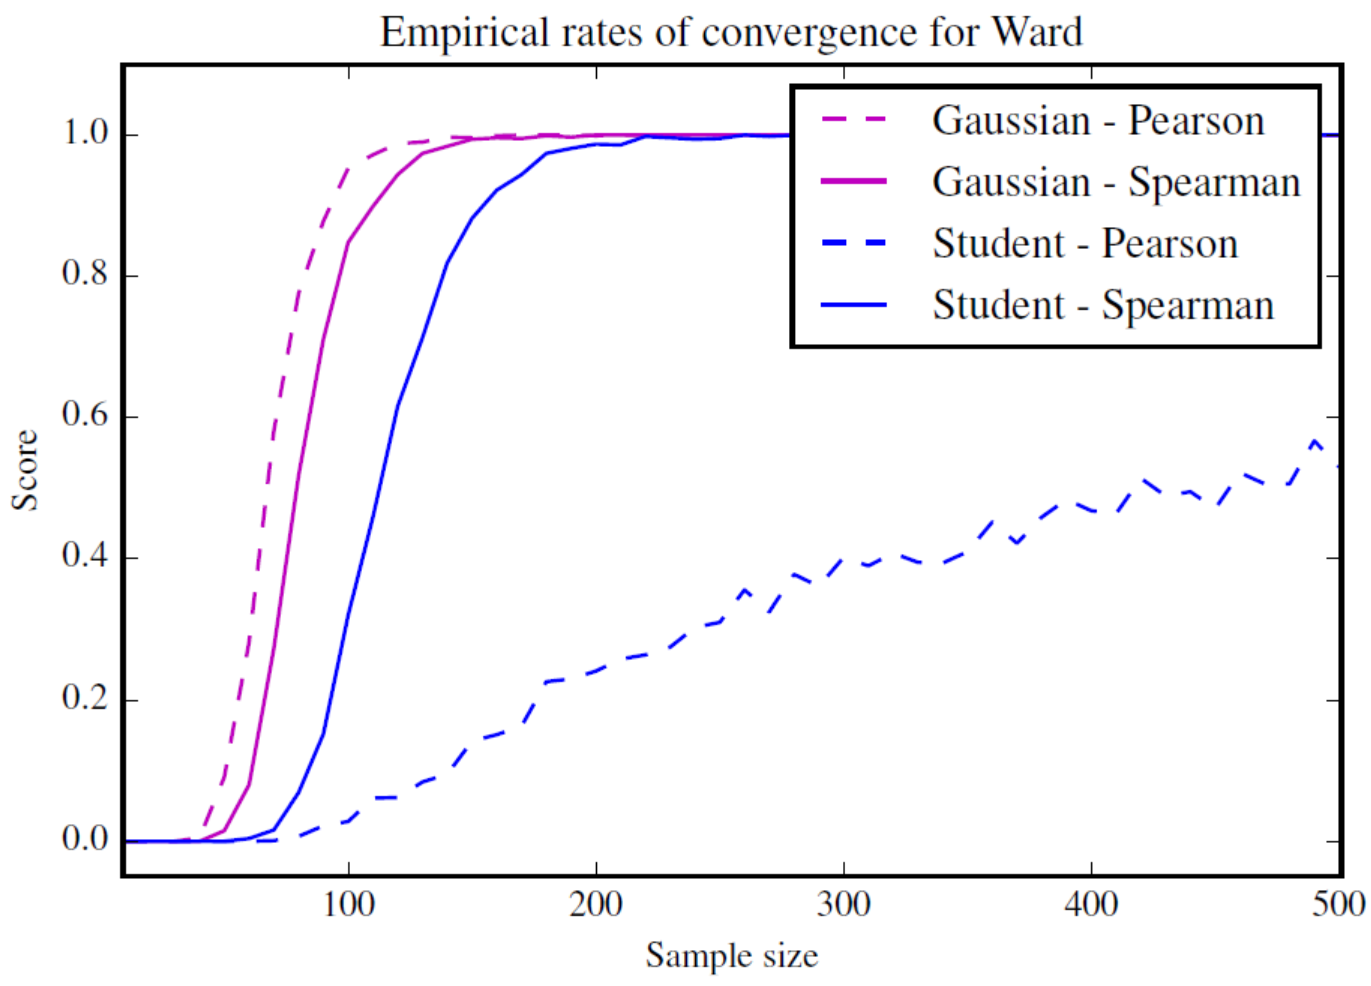
To understand how it may impact your results, consider this simple experiments.
Build a distance/correlation matrix which is 'neat'. Clusters are obvious and thus the matrix is block diagonal. Then, sample from this matrix (using a simple multivariate Gaussian if you want). Then, you can estimate how much data/realizations you may need to recover the underlying clusters. You may be surprised :) Remember that here you have assumed a very-neat situation and you have stationary (even i.i.d.) observations from a Gaussian, so the ideal case that never happens in practice! You can complexify the model with respect to your understanding of the data.
For example, with a Single Linkage clustering, you may get:

But with Ward:

If you are interested by that topic, you can have a look at this paper.


